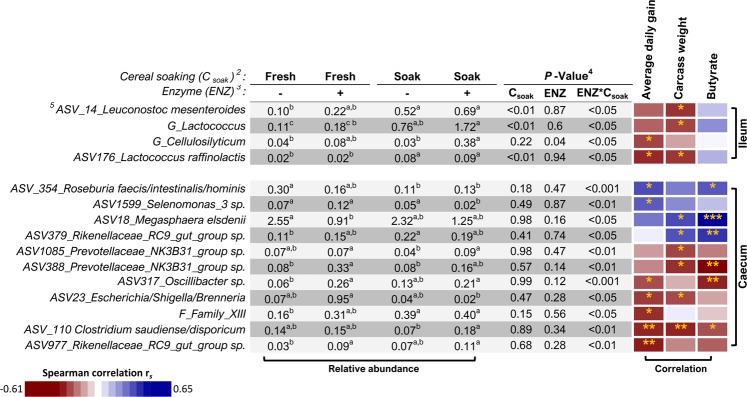
Figure 3.
Heatmap showing spearman correlations between the ileal and caecal bacterial taxa found to be differentially abundant between dietary treatments and selected physiological measures in pigs fed the different dietary treatments (n = 6/treatment). The relative abundance (%) of each dietary treatment and the corresponding P-value is shown in the adjacent table. Positive correlations are indicated in blue and negative correlations are indicated in red. Significant correlations are indicated with asterisks (P < 0.05 = *, P < 0.01 = **, P < 0.001 = ***)1. 1Values within a row that do not share a common superscript are statistically different (P < 0.05). 2Soaking the cereal fraction of the diet prior to feeding (fresh = 0 h soaking, soak = 3 h soaking). 3Enzyme supplementation with a xylanase and β-glucanase complex [unsupplemented (−), supplemented (+)]. 4P-value corrected for false discovery rate (FDR). 5F_ = Family, G_ = Genus, ASV_ = Exact amplicon sequence variant.

