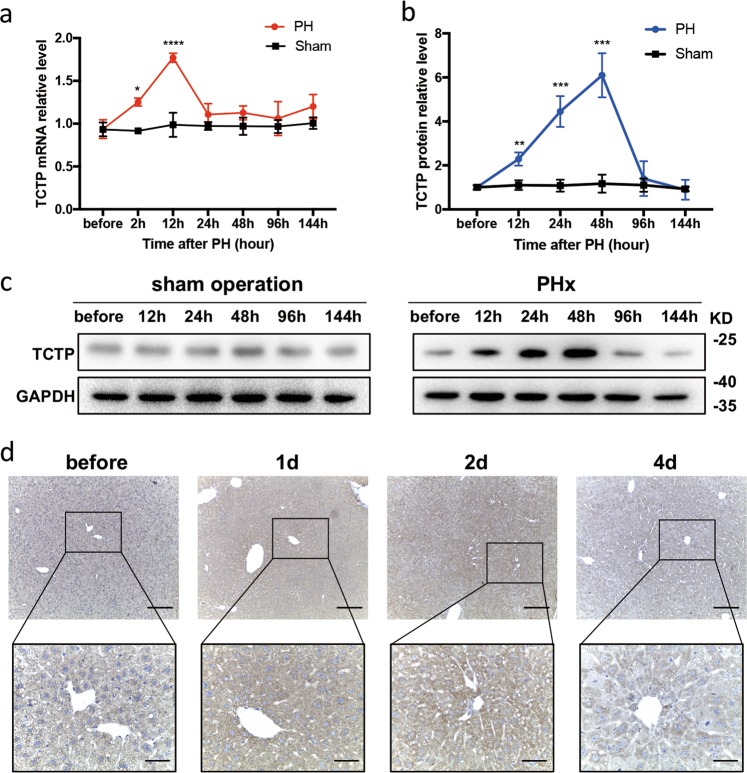
Fig. 1. TCTP was strikingly induced during liver regeneration (LR) in wild-type mice.
a The RT-PCR analysis of the TCTP mRNA expression in livers obtained from the PHx group (PH) and sham operation group (Sham) at the indicated time points of LR, and GAPDH was used as a reference gene. b Western blot analysis of the TCTP protein expression in livers obtained from the PH group and Sham group at the indicated time points of LR. The results were presented as mean ± standard deviation (SD). n = 5. *P < 0.05; **P < 0.01; ***P < 0.001; ****P < 0.0001 vs. control (Two-way ANOVA followed by Tukey’s test). c Representative western blot analysis of the TCTP protein expression in livers obtained from the PH group and Sham group at the indicated time points of LR. d Representative IHC staining of TCTP (brown) on liver sections at the indicated time points of LR; Scale bars: 200 μm (upper) and 50 μm (lower).

