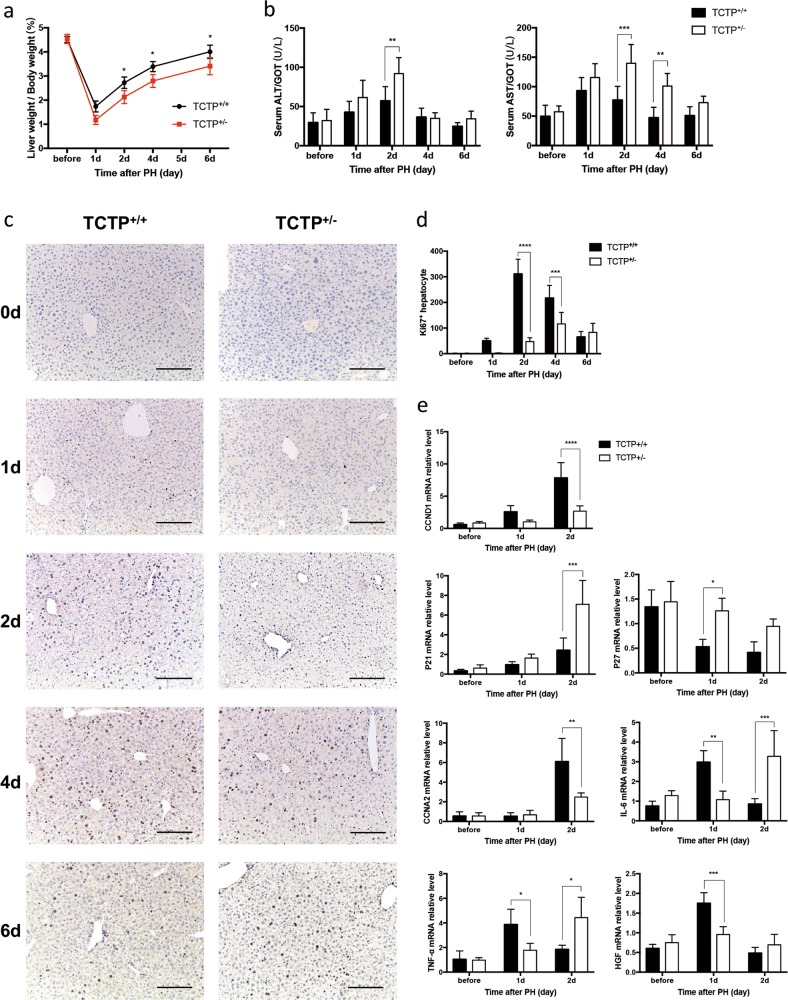
Fig. 2. Liver regeneration (LR) was inhibited in TCTP+/− mice.
a, b The liver weight/body weight ratio (a), and serum ALT and AST levels (b) of TCTP+/+ and TCTP+/− mice were measured at the indicated time points during LR. c Representative IHC staining of Ki67 (brown) on liver sections obtained from TCTP+/+ and TCTP+/− mice at the indicated time points of LR; Scale bars: 200 μm. d The number of Ki67-positive hepatocytes was counted and used as an indicator to compare with the regenerative ability of livers obtained from TCTP+/+ and TCTP+/− mice. e The RT-PCR analysis for the mRNA expression level of, CCND1, P21, P27, CCNA2, IL-6, TNF-α and HGF in livers obtained from TCTP+/+ and TCTP+/− mice at the indicated time points of LR. The results were presented as mean ± standard deviation (SD). n = 5. *P < 0.05; **P < 0.01; ***P < 0.001; ****P < 0.0001 vs. control (Two-way ANOVA followed by Tukey’s test).

