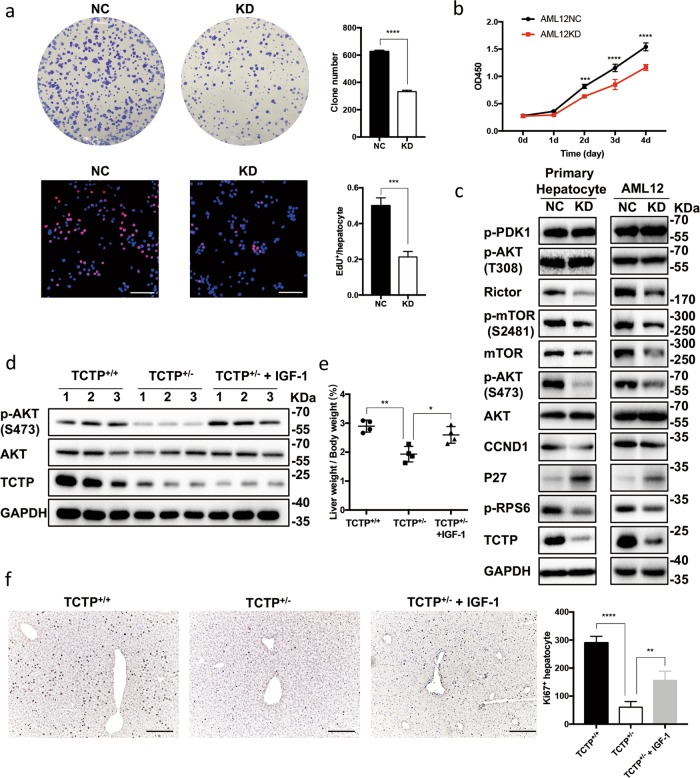
Fig. 6. TCTP facilitates hepatocyte proliferation by activating the PI3K/AKT signaling.
a Colony formation assays and EdU assays were performed on AML12-NC and AML12-TCTPKD cells. For colony formation assays, cells were seeded in 6-well plates (1 × 10³ cells/well) and incubated with LPS-CM for 10 days. For EdU assays, cells seeded in 24-well plates (5 × 10³ cells/well) were treated with LPS-CM for 2 h after serum starved for 20 h. Scale bars: 100 μm. b CCK-8 assays were performed on AML12-NC and AML12-TCTPKD cells. Cells seeded in 96-well plates (1 × 10³ cells/well) were incubated with LPS-CM. c Representative western blot analysis for the expression of PI3K/AKT pathway-related proteins in AML12-NC, AML12-TCTPKD and the primary hepatocytes obtained from TCTP+/+ and TCTP+/− mice. The hepatocytes were treated with LPS-CM for 2 h after serum starved for 20 h. Three independent experiments were carried out. d–f Representative western blot analysis for the expression of TCTP, AKT and p-AKTSer473 proteins in livers (d), the liver weight/body weight ratio (e) and Ki67 immunostaining on liver sections (f) obtained from TCTP+/+ (treated with PBS), TCTP+/− (treated with PBS), and TCTP+/− (treated with IGF-1) mice at day two after PHx. Mice were intraperitoneally injected with PBS or IGF-1 dissolved in PBS at 5 mg/kg/day, for three times a day. Scale bars: 200 μm; n = 4. The results were presented as mean ± standard deviation (SD); *P < 0.05; **P < 0.01; ***P < 0.001; ****P < 0.0001 vs. control (two-tailed Student’s t test for a; Two-way ANOVA followed by Tukey’s test for b; One-way ANOVA followed by Tukey’s test for (e, f).

