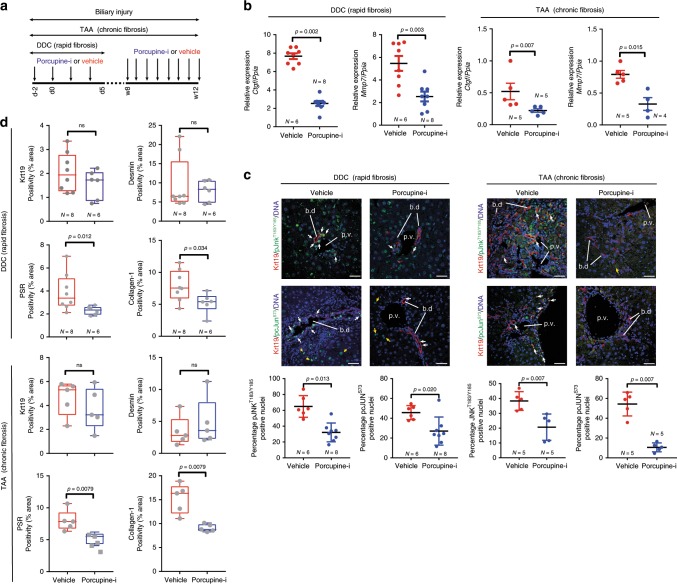
Fig. 2. Therapeutic inhibition of Wnt reduces scarring.
a Schematic of Porcupine inhibition with Porcupine-i during bile duct regeneration induced by DDC or TAA. b mRNA expression of Wnt-PCP pathway target genes Ctgf and Mmp7 in isolated bile ducts following Porcupine-i treatment, normalised to the housekeeping gene Ppia. c Immunofluorescent staining of biliary epithelial cells (Keratin-19-positive, red) with phosphorylated JNKT183/Y185 (upper panels) or phosphorylated c-JUNS73 (lower panels), green. White arrows denote positivity in biliary epithelial cells, yellow arrows show positivity in other, non-keratin-19-positive cells. Positivity of phosphorylated JNKT183/Y185 and phosphorylated c-JUNS73 quantified in dot plots and represented as a proportion of total biliary epithelial cells counted. d Histological quantification of Keratin-19 (biliary epithelial cells), Desmin (fibroblasts), Picrosirius Red, PSR (fibrilar collagens) and Collagen-1 in livers of mice treated with either DDC or TAA, following Porcupine inhibition. Scale bar = 50 µm. p.v.—portal vein, b.d.—bile duct. Source data are provided as a Source Data file. In all comparisons, a Student’s t test is used. Box–whisker plots represent min–max range of the data. In dot plots, data are presented as mean ± S.E.M. Each data point (N) represents an individual animal.

