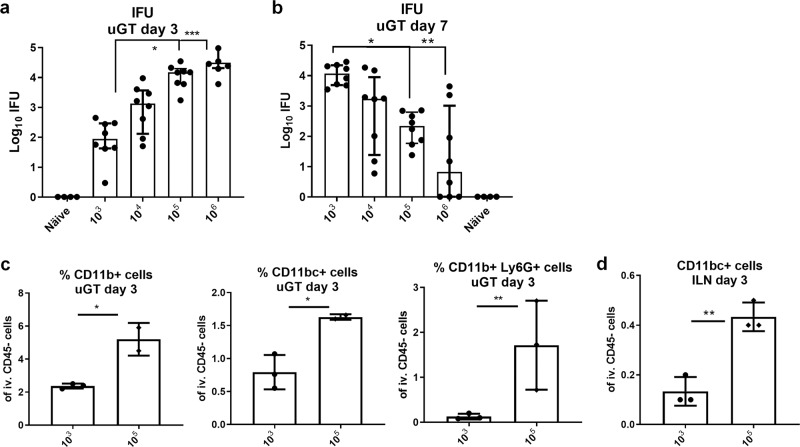
Fig. 2. Testing different infection doses.
Groups of female B6C3F1 mice (n = 8) were TC infected with different doses of C.t. SvD ranging from 103 to 106 IFU of C.t. SvD. 3 days and 7 days post infection, the bacterial burden in the uGT were determined in cultured swab samples. The data are presented as Log10 of IFUs. Bars indicate medians with IQR. Statistical significance was evaluated by a Kruskal-Wallis test followed by Dunn’s multiple comparisons test using GraphPad Prism version 7.04. (*p < 0.05, **p < 0.01) (a, b). Percentages of neutrophils (Ly6G+CD11b+), macrophages (Ly6G−CD11b+CD11c−) and dendritic cells (Ly6G−CD11b+CD11c+) were determined in the uGT and ILN 3 days post infection by flow cytometry. n = 8, animals were, pooled pairwise (c, d). Bars indicate means ± SD. Statistical significance was evaluated by an unpaired t-test using GraphPad Prism version 7.04. *p < 0.05, **p < 0.01.

