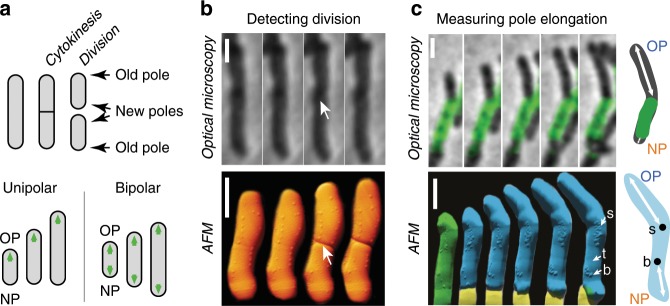
Fig. 1. Measurement of M. smegmatis pole elongation dynamics using AFM.
a Schematic of unipolar8 and bipolar7 elongation models. OP, old pole. NP, new pole. b Comparison between phase-contrast and AFM time-lapse images of dividing cells measured on different instruments. Arrows indicate the division site in the first frame following the division event. For phase-contrast microscopy data, the division event was detected using the method described in Supplementary Fig. 5. Scale bar, 1 μm. Time between consecutive images is 10 min for phase-contrast microscopy data and 13 min on average for AFM data. c Absolute measurement of pole elongation using fluorescence pulse-chase labeling and AFM-resolved surface nanostructures as fiducial markers. Scale bar, 1 μm. Top: combined phase-contrast and fluorescence images of an elongating cell. Time between consecutive images is 30 min. The schematic illustrates how fluorescently labeled cell wall (green) can be used as a fiducial marker to measure pole elongation (white arrows). Bottom: AFM time-lapse images of a mother cell (green) and its two daughter cells (blue and yellow). Surface nanostructures used as fiducial markers are indicated with a white arrow: division scar (s), protruding bleb (b), trough (t). The schematic illustrates how surface nanostructures (●) are used as fiducial markers to measure pole elongation over time. Time between two images is 1.25 h on average.

