Figure 3.
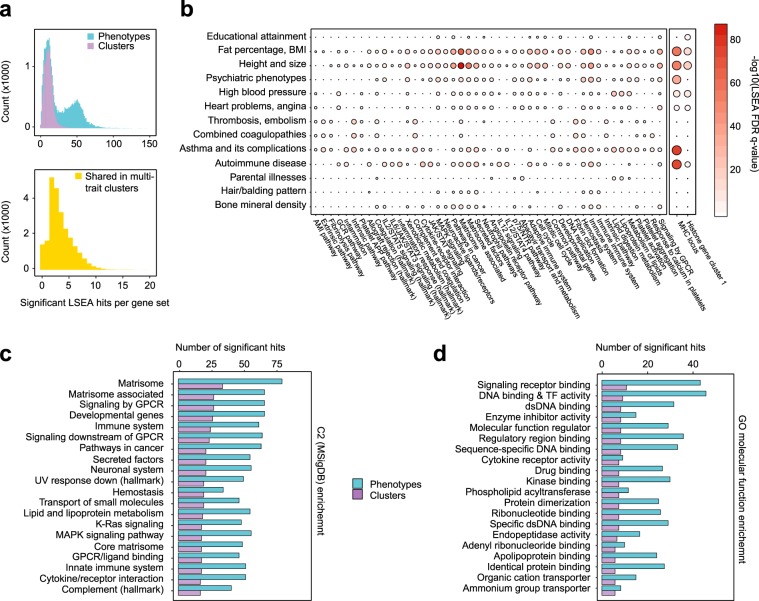
Complex trait clusters share several key enriched molecular pathways. (a) A histogram of numbers of enrichments per each gene set from the MSigDB collections. Upper panel, number of enriched phenotypes and enriched clusters; lower panel, number of clusters showing significant enrichment of 2 or more phenotypes. (b) A circle-map representation of LSEA results for common (shared by 2 or more phenotypes) associated SNPs for each multi-phenotype cluster. Only gene sets with shared enriched phenotypes in 2 or more clusters are shown (only top 100 enrichments for each cluster were chosen). (c,d) Curated gene sets (c) and GO molecular function terms (d) with the highest number of enriched clusters based on LSEA analysis. Top-20 hits are shown in each case.

