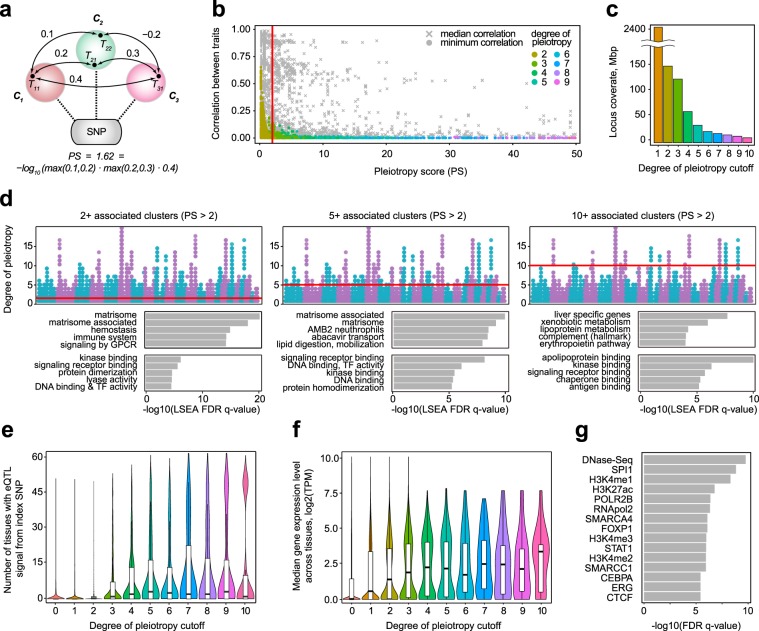
Figure 4.
Pleiotropic loci comprise broadly expressed genes with ubiquitous functions. (a) A schematic for pleiotropy score correlation. In a typical example, pleiotropy score is calculated as log-transformed product of all pairwise cluster correlation coefficients. A correlation coefficient between two clusters is defined as a maximum correlation between traits that belong to each cluster. (b) A scatterplot showing the dependence of our pleiotropy score on median (gray crosses) or minimal (colored dots) cross correlation of associated clusters for each variant. Only variants with pleiotropy score of less than 50 and degree of pleiotropy of less than 10 are shown. Point color represents the degree of pleiotropy, the color code is identical to the one used in panels (с), (d), and (e). (c) Total length of loci with a given degree of pleiotropy cutoff as given by PLINK. (d) LSEA analysis of three groups of pleiotropic variants (filtered using total product correlation) - variants with 2+ associated clusters (left), 5+ associated clusters (middle), and 10+ associated clusters (right). Top-5 enriched genesets are shown. (e) Distributions of the number of tissues with significant eQTL signal for variant groups with different degree of pleiotropy cutoffs. (f) Distributions of median expression levels across GTEx tissues (log2(transcripts per million)) for genes located at loci with different degrees of pleiotropy. (g) Results of the ChIP-Atlas enrichment analysis29 of the pleiotropic loci vs blood-derived genomic tracks (see Methods). Top-15 enriched tracks are shown.

