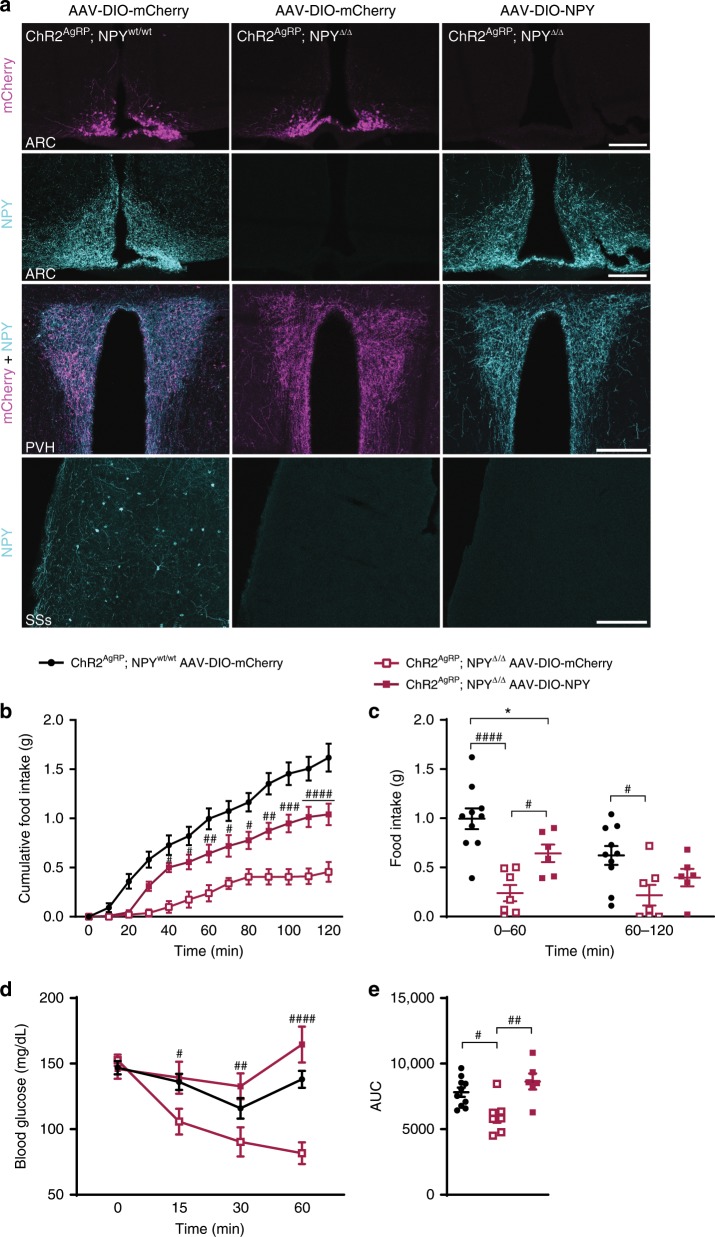
Fig. 5. Virally transduced re-expression of NPY selectively in AgRP neurons of NPY knockout mice restores the feeding response and insulin resistance upon optogenetic activation of AgRP neurons.
a Microphotographs show the successful expression of bilaterally delivered control virus (AAV-DIO-mCherry) in ChR2AgRP; NPYwt/wt and ChR2AgRP; NPYΔ/Δ mice, and NPY virus (AAV-DIO-NPY) in ChR2AgRP; NPYΔ/Δ mice in the ARC. Note the presence of NPY containing fibers in the PVH of ChR2AgRP; NPYΔ/Δ mice re-expressing NPY, which is absent in the corresponding control. In contrast, the supplementary somatosensory area of the cortex (SSs), which receives no projections from the ARC, displays NPY labeling only in ChR2AgRP; NPYwt/wt mice. Scale bar = 200 µm. b, c Cumulative and total food intake upon AgRP neuronal stimulation in virally transduced NPY-deficient and wildtype control mice (mCherry) and in NPY-deficient mice re-expressing NPY in the ARC. d, e Blood glucose levels upon AgRP neuronal activation during insulin tolerance tests and corresponding area under the curve (AUC) in virally transduced NPY-deficient and wildtype control mice (mCherry) and in NPY-deficient mice re-expressing NPY in the ARC. n = 10 and n = 7 mice for ChR2AgRP; NPYwt/wt and ChR2AgRP; NPYΔ/Δ injected with mCherry virus and n = 6 mice for ChR2AgRP; NPYΔ/Δ injected with NPY virus. Data are shown as mean ± s.e.m. Statistical analysis is represented by *p ≤ 0.05, #p ≤ 0.05, ##p ≤ 0.01, ###p ≤ 0.001, and ####p ≤ 0.0001 as determined by two-way ANOVA (panels b–d) followed by Tukey post hoc test, or one-way ANOVA (panel e) followed by Tukey post hoc test. In panels b and d, # represents comparisons between NPY re-expressing mice and NPY-deficient mice injected with control virus. Source data are provided as a Source Data file.

