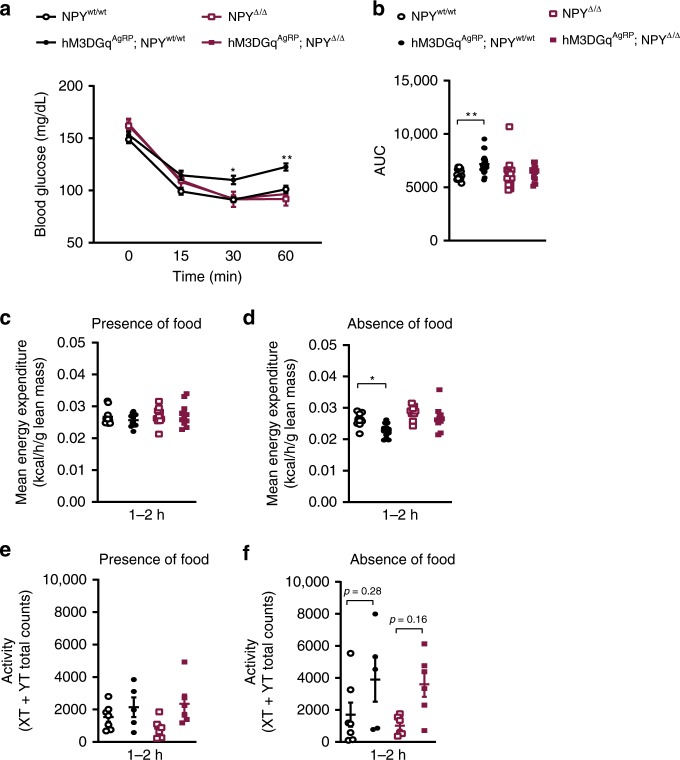
Fig. 7. NPY is necessary for the acute insulin resistance upon chemogenetic activation of AgRP neurons.
a, b Insulin tolerance test in NPY-expressing and NPY-deficient mice and corresponding area under the curve (AUC); n = 17 mice for NPYwt/wt, n = 23 mice for hM3DGqAgRP; NPYwt/wt, n = 14 mice for NPYΔ/Δ and n = 15 mice for hM3DGqAgRP; NPYΔ/Δ). c Energy expenditure in the presence of food (1–2 h post injection) is similar in all groups of mice (n = 10 mice for NPYwt/wt, hM3DGqAgRP; NPYwt/wt and NPYΔ/Δ, and n = 11 mice for hM3DGqAgRP; NPYΔ/Δ). d Energy expenditure in the absence of food (1–2 h post injection) is dependent on NPY expression (n = 10 mice for NPYwt/wt, n = 12 mice for hM3DGqAgRP; NPYwt/wt, n = 9 mice for NPYΔ/Δ and n = 10 mice for hM3DGqAgRP; NPYΔ/Δ). e Locomotor activity in the presence of food (1–2 h post injection) is similar in all groups of mice (n = 7 for NPYwt/wt, n = 5 for hM3DGqAgRP; NPYwt/wt and n = 6 for NPYΔ/Δ and hM3DGqAgRP; NPYΔ/Δ). f Locomotor activity in the absence of food (1–2 h post injection) is largely independent of NPY (n = 7 for NPYwt/wt, n = 5 for hM3DGqAgRP; NPYwt/wt and n = 6 for NPYΔ/Δ and hM3DGqAgRP; NPYΔ/Δ). All animals were injected with CNO. Data are shown as mean ± s.e.m. Statistical analysis is represented by *p ≤ 0.05 and **p ≤ 0.01 as determined by one-way ANOVA followed by Tukey post hoc test, except for panel a, where a two-way ANOVA followed by Tukey post hoc test was performed. Source data are provided as a Source Data file.

