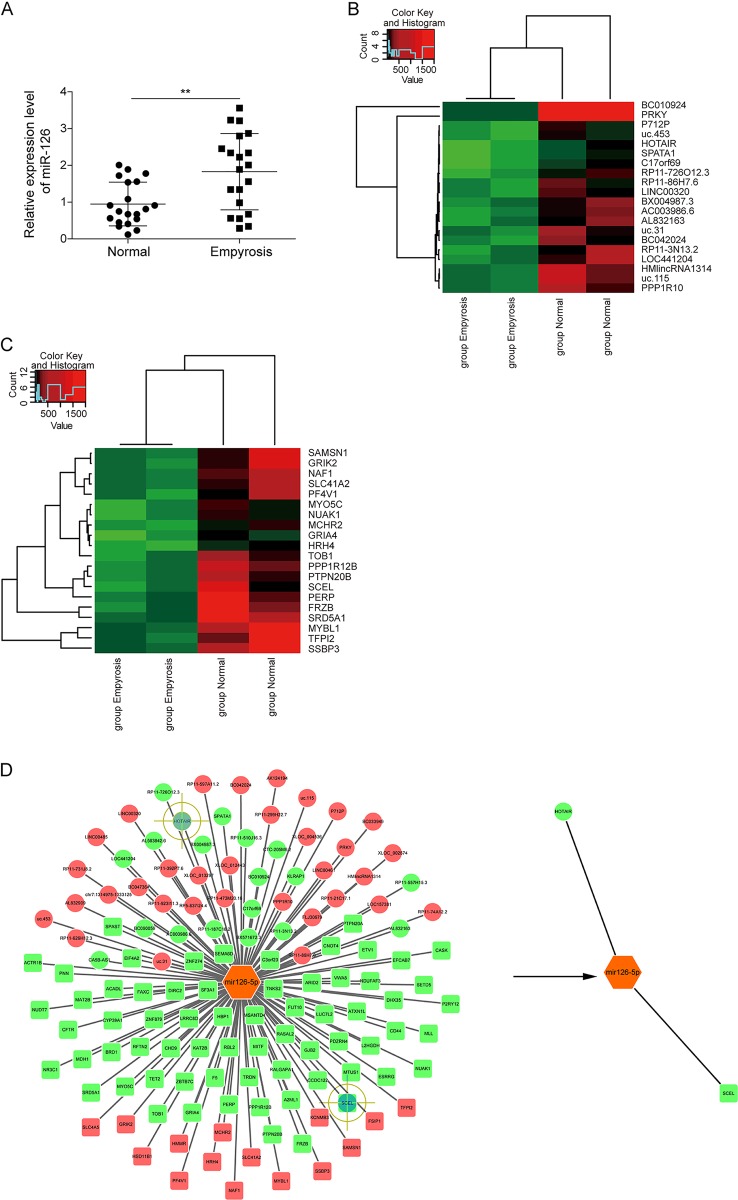
Fig. 1. Profiles of differentially expressed genes in burn wound tissue compared to controls.
a miR-126 levels in burn wound tissues and paired adjacent normal tissues were determined by qRT-PCR. U6 served as an internal control. **P < 0.01. b Top20 differentially expressed lncRNAs and c mRNAs in five pairs of samples with mostly increased miR-126 levels were subjected to hierarchical clustering. Red color indicated high relative expression and green color indicated low relative expression. d Construction of the miR-126, lncRNAs, and mRNA co-expression network. Red and green color represent up- and down-regulation, respectively.

