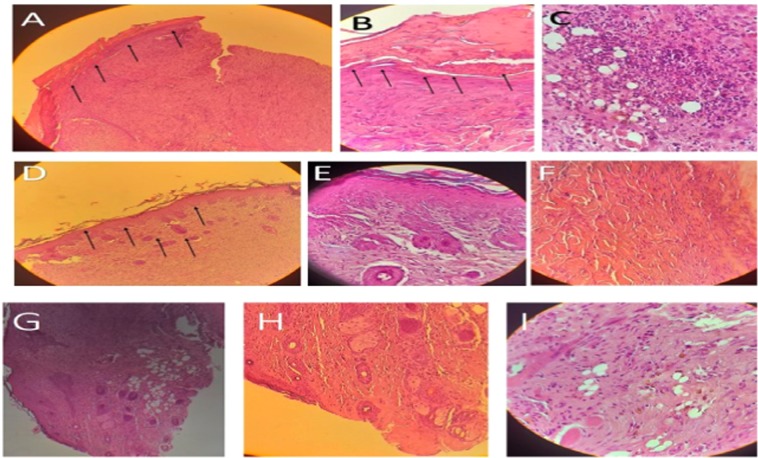
Figure 4.
Histological analysis of wound tissue from day 14 using hematoxylin and eosin (H&E) (magnification 10× , and 40×). (A,D and G) compared the epidermis and the extracellular matrix which is thinner in (A) (untreated control wounds) compared to (D and G) (freeze or CaCl2-PdB treated wound). (B,E and H) 40× magnification of the Histologic wound shows the separated epidermis in B (untreated control wounds) and new angiogenesis in (E and H) (freeze or CaCl2-PdB treated wound). (C,F and I) 40× magnification of the Histologic wound shows the inflammation and cell aggregation in (C) (untreated control wounds) and collagen production (F and I) (freeze or CaCl2-PdB treated wound).

