. 2019 Dec 25;36(4):253–263. doi: 10.5511/plantbiotechnology.19.1030a

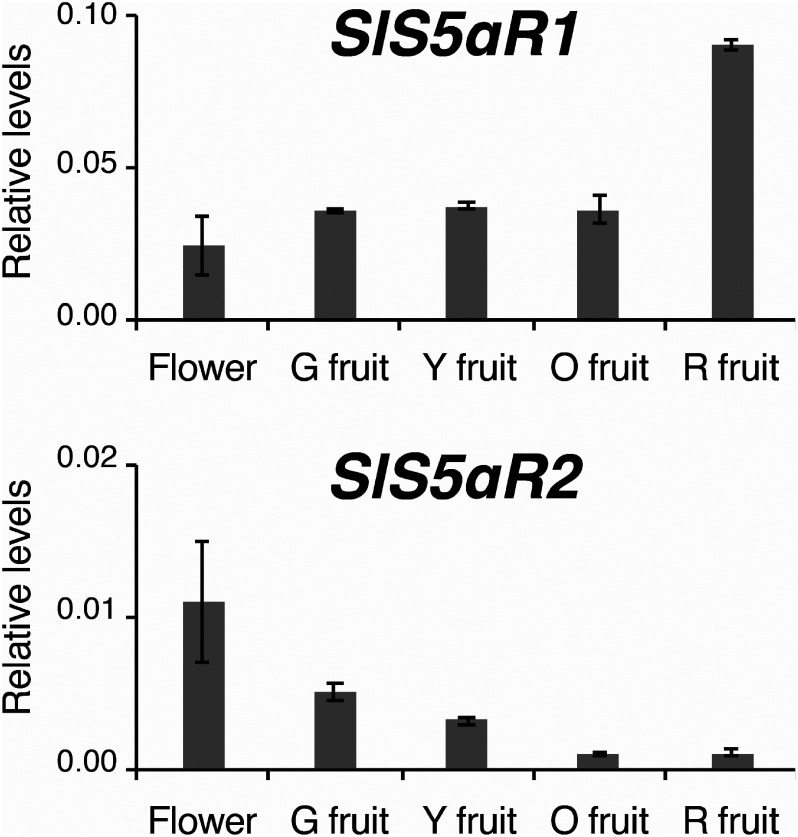
Figure 3. Quantitative RT-PCR analysis of SlS5αR1 and SlS5αR2 expression in various tissues of tomatoes. G, Y, O, and R mean green, yellow, orange, and red, respectively. Transcript levels of SlS5αR1 and SlS5αR2 are shown relative to that of the ubiquitin gene as an internal reference. Error bars indicate standard error from the mean (n=3).

Figure 3. Quantitative RT-PCR analysis of SlS5αR1 and SlS5αR2 expression in various tissues of tomatoes. G, Y, O, and R mean green, yellow, orange, and red, respectively. Transcript levels of SlS5αR1 and SlS5αR2 are shown relative to that of the ubiquitin gene as an internal reference. Error bars indicate standard error from the mean (n=3).