. 2019 Dec 25;36(4):253–263. doi: 10.5511/plantbiotechnology.19.1030a

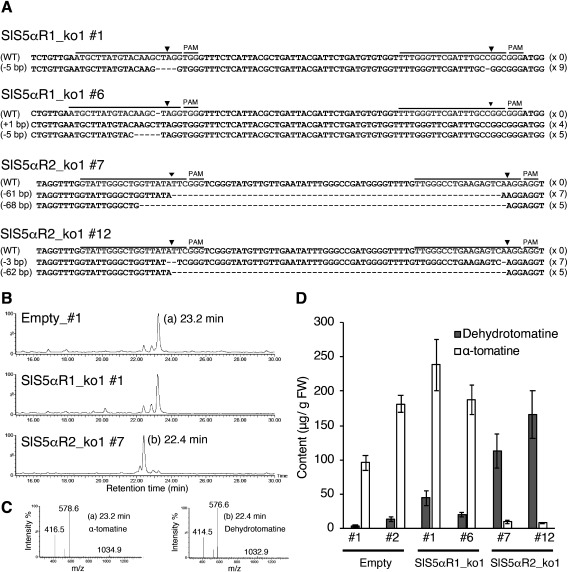
Figure 6. Characterization of SlS5αR1 or SlS5αR2-disrupted tomato hairy roots. (A) DNA sequences of gRNA target sites. Black and gray lines indicate gRNA target sites and PAM sequences, respectively. Black triangles indicate cleavage positions of target sites. Deletions or insertions of nucleotides are presented on the left sides of the sequences, and the numbers of detected sequences are shown on the left sides. (B) LC-MS analysis of SGAs in SlS5αR1_ko1_#1 and SlS5αR2 _ko2_#7. (C) Mass spectrum of the α-tomatine (peak at 23.2 min) and dehydrotomatine (peak at 22.4 min). (D) Quantification of α-tomatine and dehydrotomatine contents using LC-MS. Error bars indicate standard error (n=3).

Figure 6. Characterization of SlS5αR1 or SlS5αR2-disrupted tomato hairy roots. (A) DNA sequences of gRNA target sites. Black and gray lines indicate gRNA target sites and PAM sequences, respectively. Black triangles indicate cleavage positions of target sites. Deletions or insertions of nucleotides are presented on the left sides of the sequences, and the numbers of detected sequences are shown on the left sides. (B) LC-MS analysis of SGAs in SlS5αR1_ko1_#1 and SlS5αR2 _ko2_#7. (C) Mass spectrum of the α-tomatine (peak at 23.2 min) and dehydrotomatine (peak at 22.4 min). (D) Quantification of α-tomatine and dehydrotomatine contents using LC-MS. Error bars indicate standard error (n=3).