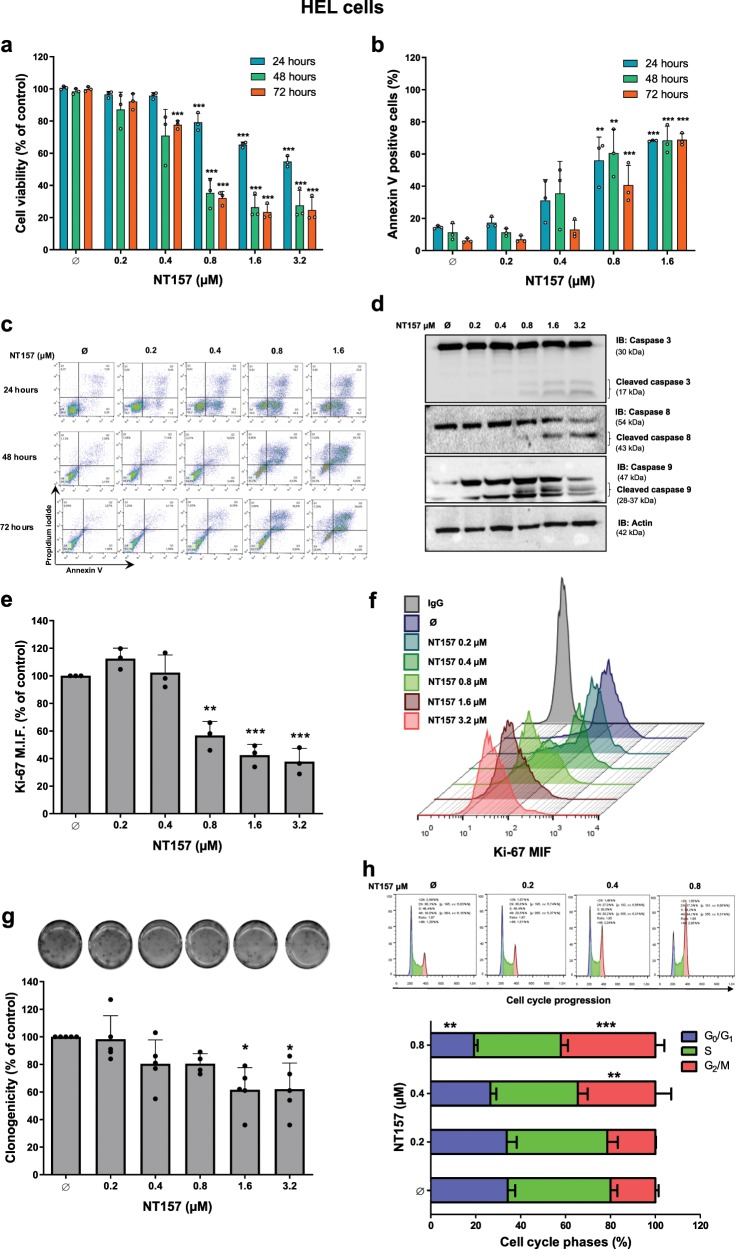
Fig. 1. NT157 treatment results in a reduction in cell viability, proliferation, and clonogenicity and promotes induced mitotic catastrophe in HEL JAK2V617F cells.
a Cell viability was determined by methylthiazole tetrazolium (MTT) assays for HEL cells with or without NT157 treatment (0.2, 0.4, 0.8, 1.6, and 3.2 µM) for 24, 48, and 72 h. Bar graphs represent the mean ± SD of at least three independent experiments, and the dots represent the value of each experiment; ***p < 0.0001 for NT157-treated cells vs. untreated cells, and analysis was performed with an ANOVA test and a Bonferroni post-test. b Apoptosis was detected by flow cytometry in HEL cells with or without NT157 treatment (0.2, 0.4, 0.8, and1.6 µM) for 24, 48, and 72 h using an annexin V/PI staining method. Bar graphs represent the mean ± SD of at least three independent experiments where annexin V-positive cells were quantified, and the dots represent the value of each experiment; **p < 0.001 and *** p < 0.0001 for NT157-treated cells vs. untreated cells, and analysis was performed with an ANOVA test and a Bonferroni post-test. c Representative flow cytometry dot plots are shown for each condition; the upper and lower right quadrants cumulatively contain the apoptotic population (annexin V-positive cells). d Caspases 3, 8, and 9 levels (total and cleaved) were assessed by western blot analysis in total cell extracts from HEL with NT157 treatment (Ø, 0.2, 0.4, 0.8, 1.6, and 3.2 µM) for 24 h; membranes were reprobed with antibodies to detect total target protein and/or actin, and then they were developed with a SuperSignal™ West Dura Extended Duration Substrate system and a Gel Doc XR + system. e Ki-67 mean fluorescence intensity (MFI) was determined by flow cytometry after incubation of HEL cells with NT157 (Ø, 0.2, 0.4, 0.8, 1.6, and 3.2 µM) for 24 h; bar graphs represent the Ki-67 MFI normalized to the respective untreated control cells, and the results are shown as the mean ± SD of three independent experiments. The dots represent the value of each experiment; **p < 0.001, and ***p < 0.0001, and analysis was performed with an ANOVA test and a Bonferroni post-test. f Histograms show Ki-67 MFI peaks for all tested conditions. Each condition is represented by one color that is defined in the legend located in the left panel. g Colonies containing viable cells were detected by MTT assay after 10 days of culture with NT157, and data are normalized to the corresponding untreated control. Colony images are shown for one experiment, and the bar graphs show the mean ± SD of five independent experiments. The dots represent the value of each experiment; *p < 0.05 for NT157-treated cells vs. untreated cells, and analysis was performed with an ANOVA test and a Bonferroni post-test. h Cell cycle progression was determined by a BD Cycletest™ Plus DNA Reagent Kit in HEL cells treated with NT157 (Ø, 0.2, 0.4, and 0.8 µM) for 24 h. A representative histogram for each condition is illustrated; cell cycle phases are detected based on DNA quantity: blue (cells in G0/G1), green (cells in S), and pink (G2/M cells). Bar graphs represent the mean ± SD of the percent of cells in the G0/G1, S, and G2/M phase of three independent experiments; **p < 0.001 and ***p < 0.0001, and analysis was performed with an ANOVA test and a Bonferroni post-test.

