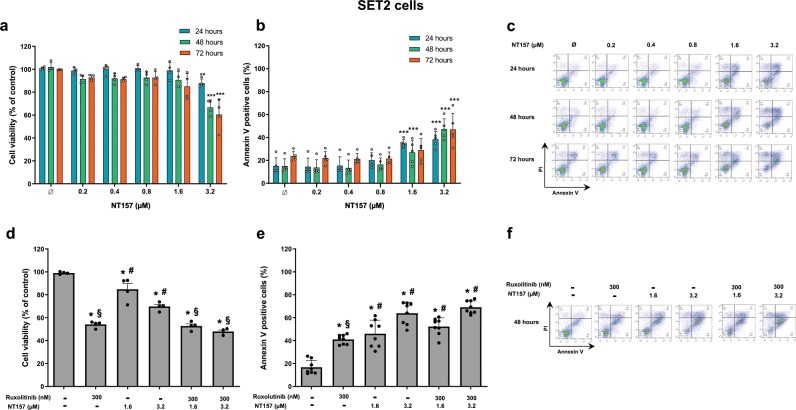
Fig. 5. In SET2V617F cells, high doses of NT157 produce antineoplastic effects, but combined NT157 and ruxolitinib treatment does not potentiate the effects of monotherapies.
a Cell viability was determined by methylthiazole tetrazolium (MTT) assay for SET2 cells with or without NT157 treatment (0.2, 0.4, 0.8, 1.6, and 3.2 µM) for 24, 48, and 72 h. Bar graphs represent the mean ± SD of four independent experiments, and the dots represent the value of each experiment; **p < 0.001, and ***p < 0.0001 for NT157-treated cells vs. untreated cells, and analysis was performed with an ANOVA test and a Bonferroni post-test. b Apoptosis was detected by flow cytometry in SET2 cells with or without NT157 treatment (0.2, 0.4, 0.8, 1.6, and 3.2 µM) for 24, 48, and 72 h using an annexin V/PI staining method. Bar graphs represent the mean ± SD of five independent experiments quantifying apoptotic cell death; the dots represent the value of each experiment. c Representative flow cytometry dot plots are shown for each condition. d Cell viability was determined by MTT assay for SET2 cells treated with NT157 and/or ruxolitinib for 48 h. Bar graphs represent the mean ± SD of four independent experiments; the dots represent the value of each experiment. e Apoptosis was detected by flow cytometry in SET2 cells treated under the same conditions described for the MTT assay using an annexin V/PI staining method. Bar graphs represent the mean ± SD of eight independent experiments quantifying apoptotic cell death. For all graphs presented, *p < 0.05 related to untreated cells, #p < 0.05 related to ruxolitinib monotherapy, and §p < 0.05 related to NT157 monotherapy in the corresponding dose; analyses were performed with ANOVA tests and Bonferroni post-tests. f Representative flow cytometry dot plots are shown for each condition.

