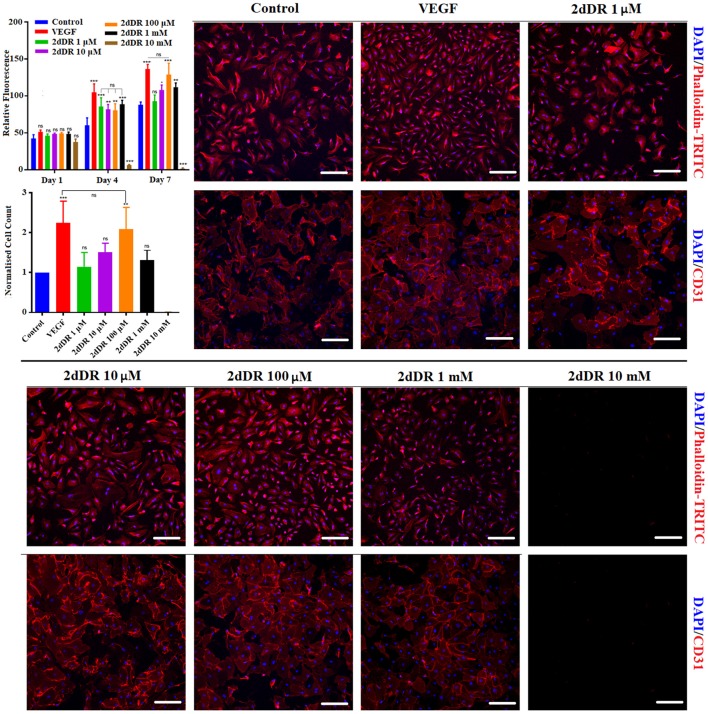
Figure 3.
(Top graph) The metabolic activities of HAECs over 7 days and (bottom graph) the normalized number of HAECs at the end of day 7. DAPI/Phalloidin staining and CD31 expressions of HAECs at the end of day 7 when treated with different concentrations of 2dDR in comparison with VEGF and controls [***p ≤ 0.001, **p ≤ 0.01, *p ≤ 0.05, not significant (ns) p ≥ 0.05, n = 3]. Scale bars represent 200 μm.

