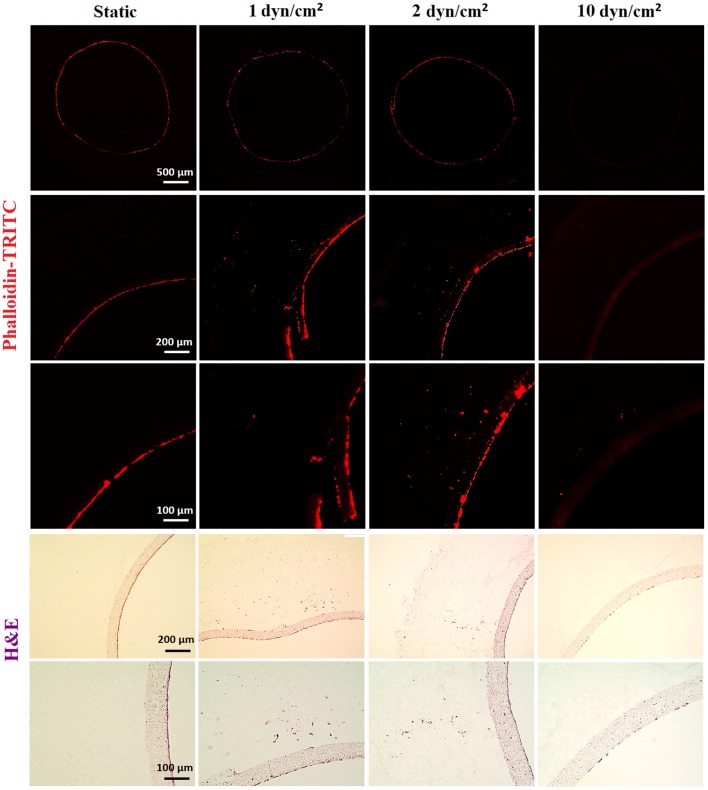
Figure 7.
Effect of flow on the outgrowth distance, cell density and the cell monolayer formation of HAECs. (Top) Phalloidin TRITC, (Bottom) H&E staining of the sections of the bilayer tubes cultured with HAECs for a week under static culture and dynamic culture with 1, 2, and 10 dyn/cm2 flow from left to right, respectively.

