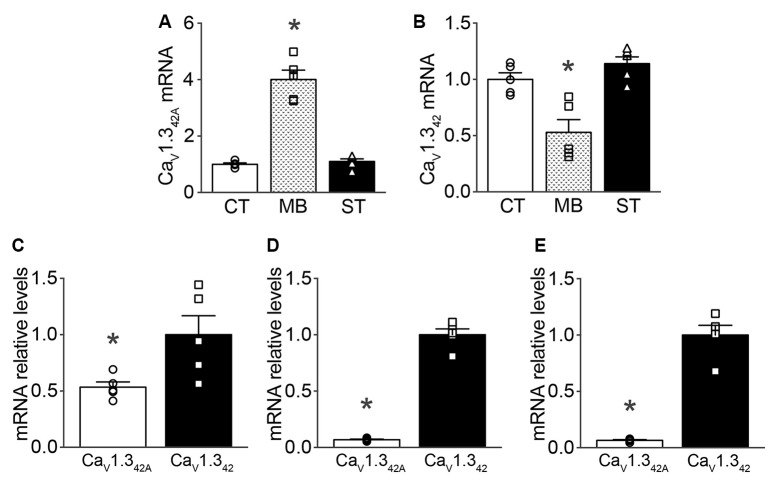
Figure 1.
CaV1.342 and CaV1.342A mRNA expression levels in mouse brain regions as measured by qRT-PCR. (A) Expression of CaV1.342A (F(2,12) = 15.54, p = 0.0005), (B) CaV1.342 (F(2,12) = 73.22, p < 0.0001) in the ventral midbrain (MB) in comparison to expression profiles in the cortex (CT) and striatum (ST). Panels (C–E) describe the relative expression of CaV1.342A to CaV1.342 in ventral midbrain (p = 0.0281, t = 2.675, df = 8), cortex (p < 0.0001, t = 17.78, df = 8) and striatum (p < 0.0001, t = 10.86, df = 8), respectively. Data were normalized to mean of 18S rRNA, β-actin and GAPDH as endogenous controls. Each dot in the figure represents an individual animal. One-way ANOVA with Newman–Keuls test was performed for multiple comparisons and unpaired, two-tailed student’s t-test was performed for pair-wise comparisons on the data. Data represented as mean ± SEM. *p < 0.05.

