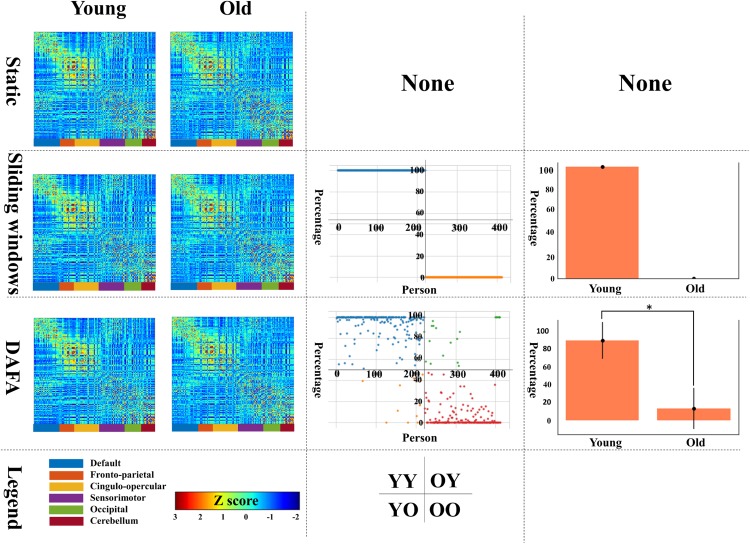
FIGURE 3.
The first column shows the average FC patterns of the young group and old group on the left and right, respectively; the second column shows the distribution of “young FCs” (samples in blue indicate individuals in the young group whose percentage of “young FCs” is greater than 50%; samples in orange indicate individuals in the young group whose percentage of “young FCs” is equal to or below 50%; samples in green indicate individuals in the old group whose percentage of “young FCs” is above 50%; and samples in yellow indicate individuals in the old group whose percentage of “young FCs” is equal to or less than 50%); the third column shows the mean and standard deviation of “young FCs” in the two groups. YY indicates samples in the young group for whom more than 50% of the FCs were relabeled to young; YO indicates samples in the young group for whom more than 50% of the FCs were relabeled to old; OO indicates samples in the old group for whom more than 50% of the FCs were relabeled to old; and OY indicates samples in the old group for whom more than 50% of the FCs were relabeled to young.

