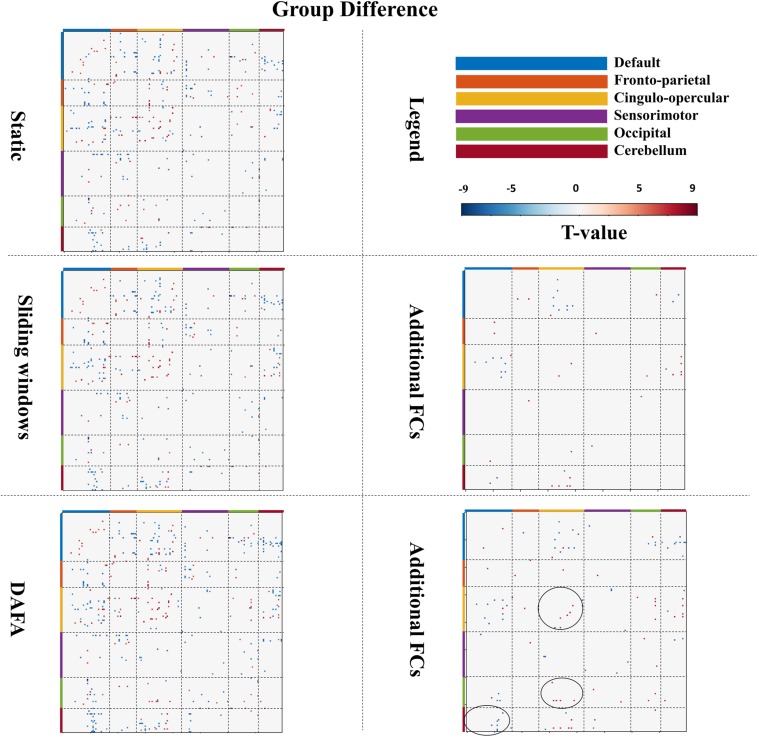
FIGURE 4.
Figures in the left column show significant changes in FCs (T-map, p < 0.01, FWE corrected) between the young and old groups via the static, sliding windows and DAFA methods. Blue indicates that the FC from the old group is stronger than that from the young group (i.e., old > young), and red indicates that the FC from the young group is stronger than that from old group (i.e., young > old). The figures in the right column show additional FCs revealed by the sliding windows and DAFA methods compared with the static method. Areas marked by circle indicated the additional altered FCs found by DAFA, compared with the sliding windows method.

