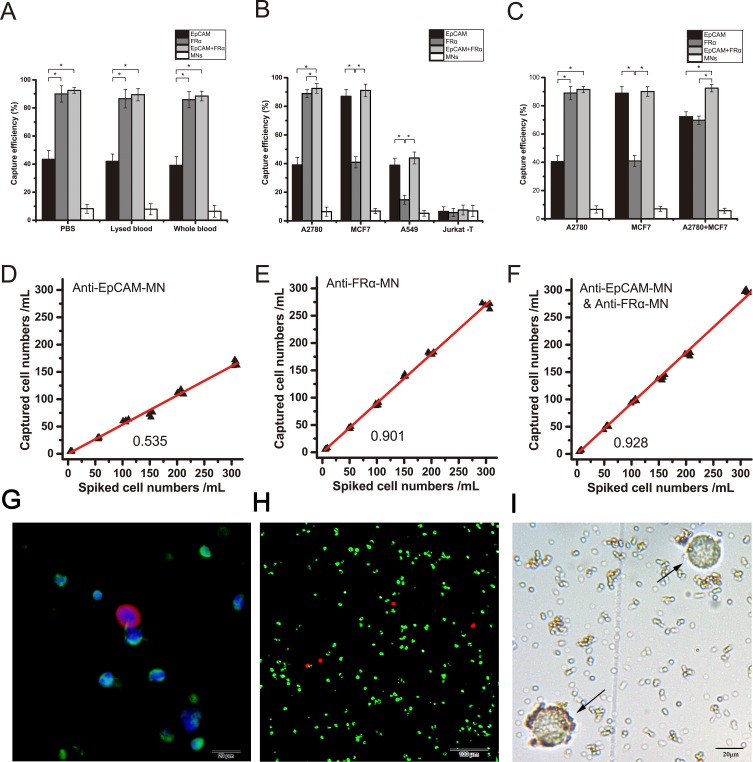
Figure 2.
Efficiencies of anti-EpCAM-MNs and anti-FRα-MNs used alone or in combination to capture target cells. (A) Capture efficiencies of using anti-EpCAM-MNs alone, anti-FRα-MNs alone, or a combination of both to capture A2780 cells in PBS, lysed blood, and whole blood, and unmodified MNs served as a negative control. (B) Capture efficiencies of using anti-EpCAM-MNs alone, anti-FRα-MNs alone, or a combination of both for capturing A2780 cells ( ), MCF7 cells (
 ), A549 cells (
 ), and Jurkat T-cells (
 ). (C) Capture efficiencies of anti-EpCAM-MNs (light gray), anti-FRα-MNs (dark gray), combination of anti-EpCAM-MNs and anti-FRα-MNs (white), and unmodified MNs (black) to capture A2780, MCF7, or a mixture of A2780 and MCF7 cells. (D, E, F) The regression analysis plots of recovered vs spiked A2780 cells detected using anti-EpCAM-MNs (D), anti-FRα-MNs (E), and a combination of anti-EpCAM-MNs and anti-FRα-MNs (F). (G) Three-color ICC identified the capture cells. CTCs were CK19-positive (red), DAPI-positive (blue), and CD45-negative (green). (H) Fluorescence microscopic image of the captured cells stained with calcein-AM (green) and propidium iodide (red). (I) Bright field photograph of the captured cells shows that the cells remain intact (arrows). Each experiment was repeated three times. *P < 0.05.

