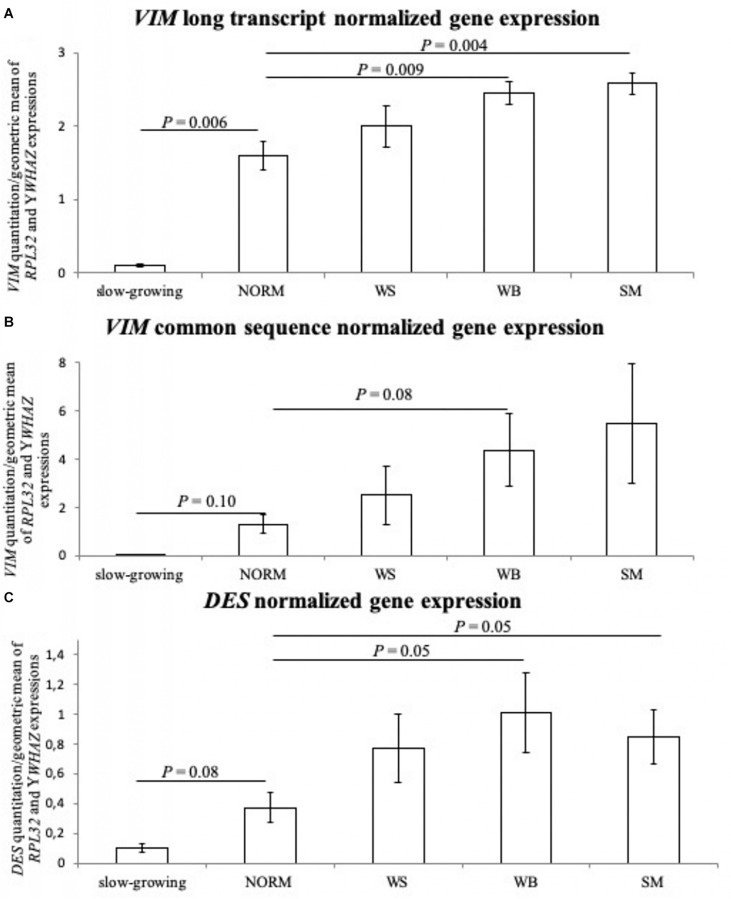
FIGURE 4.
The normalized expression values observed for the tested groups: normal (NORM), White-Striping (WS), Wooden Breast (WB), and Spaghetti Meat (SM) samples. Furthermore, the normalized gene expression levels were also reported for the slow-growing samples, and their values were used to compare the gene expressions measured in NORM group. Panel (A) shows the normalized expression levels obtained with the primer couple specific for Vimentin (VIM) long-isoform; (B) reports the normalized expression levels obtained with the primers designed on Vimentin (VIM) sequence common to both gene isoform; (C) shows the normalized expression levels of Desmin (DES) gene. The measured standard errors are graphically represented by error bars, and only the significant P-values (P ≤ 0.05) and trends toward significance (P ≤ 0.10) are reported for the comparisons between group gene expressions.

