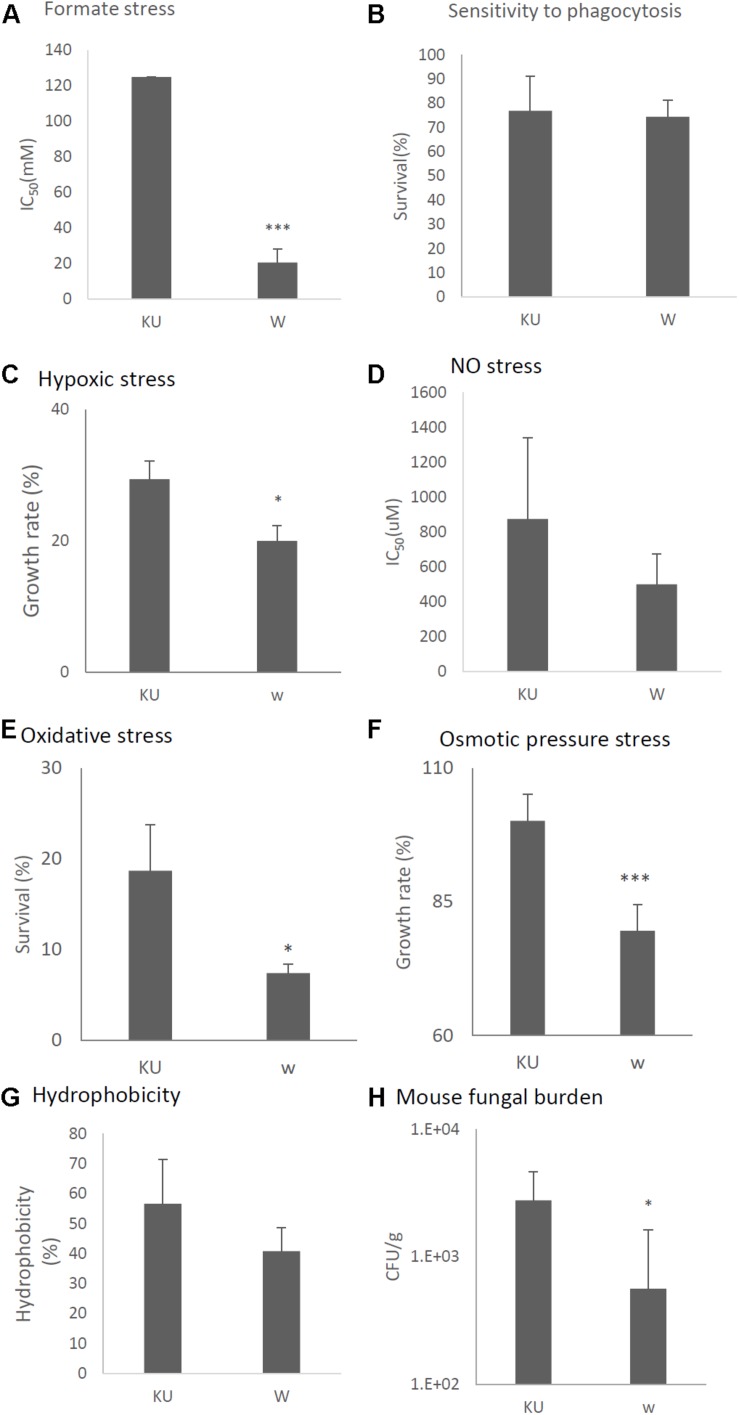
FIGURE 11.
Comparisons of tolerance to stresses, response of mammalian cells, and virulence of the virus-infected KU strain and KU strain. KU, the virus-free KU strain. w, the virus-infected KU strain. The labels are common from A to G. (A) IC50 of the strains under formate stress conditions (RPMI 1640 medium). (B) Sensitivity of the A. fumigatus strains to phagocytosis by A.1, a murine macrophage cell line. Techniques are described in the section “Materials and Methods.” (C) Growth of the fungal strains under hypoxic stress conditions. (D) IC50 of the strains under NO stress conditions (NOC-18 in RPMI 1640 medium). (E) Effect of hydrogen peroxide on the growth of the fungal strains. (F) Growth of the fungal strains under osmotic stress conditions. (G) Hydrophobicity. (H) The number of colonies per gram of lung tissue isolated from mice at 72 h after fungal infection. Data are presented as mean ± SD using four mice per group. ∗P < 0.05. For panels (B–G), data are presented as mean ± SD of three independent experiments. ∗P < 0.05, ∗∗∗P < 0.001 by two-tailed Student’s t-test comparison of the virus-infected (w) strains to the KU strain.

