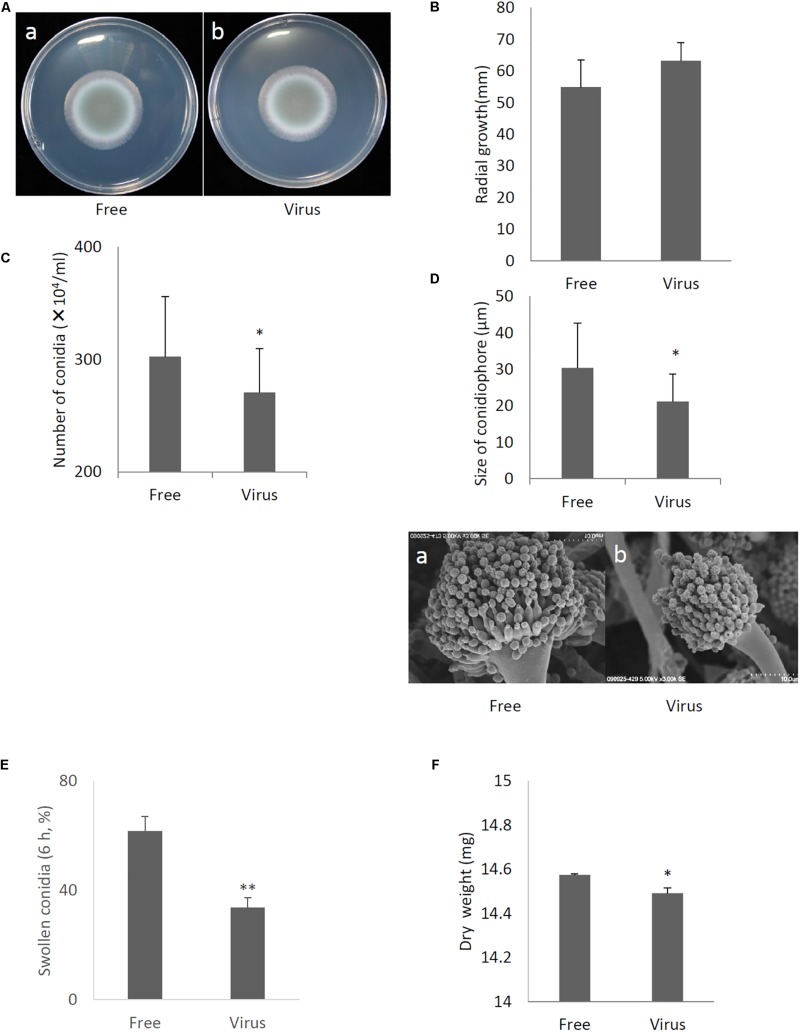
FIGURE 5.
Comparisons of colony morphology and conidial formation of virus-free (Free) and virus-infected (Virus) strains. (A) Colony morphology of AfuCV41362 virus-free (a) and virus-infected (b) A. fumigatus strains (cultured for 2 days). (B) Radial growth of colonies formed by virus-free and AfuCV41362 virus-infected A. fumigatus strains. (C) Numbers of conidia formed by the strains at 24 h after starting point inoculation. (D) Top: Sizes of conidiophores formed by the virus-free and virus-infected strains. Data are presented as mean + SD of three independent experiments. ∗P < 0.05, by two-tailed Student’s t-test. The data pair of panel B was not statistically significant. Bottom: SEM images of the virus-free (a) and virus-infected (b) strains. Calibration, 10 μm. (E) Comparisons of conidia swelling of virus-free (Free) and virus-infected (Virus) strains. Percentages of swelling (6 h) conidia formed by the virus-free and virus-infected strains. Data are presented as mean + SD of three independent experiments. ∗∗P < 0.01, by two-tailed Student’s t-test. (F) Mycelial growth. Growth was quantified by measuring dry weights of mycelia at 24 h after starting incubation of conidia.

