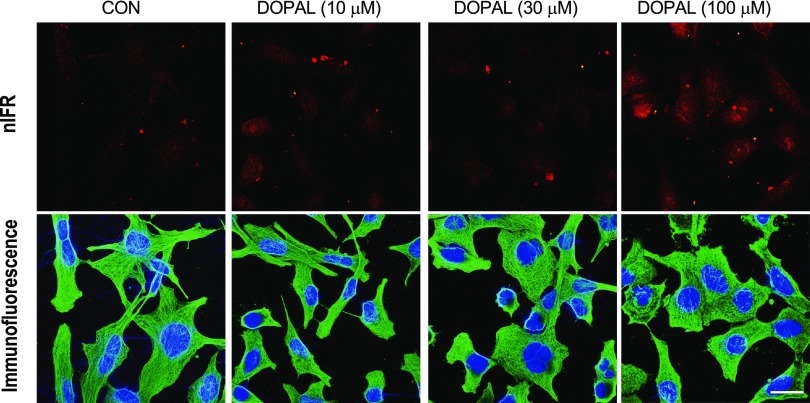
Fig. 7.
Visualization of intracellular DOPAL-induced quinoproteins. MO3.13 cells were cultured in slide chambers (8 × 10⁴ cells/slides) for 24 hours and treated with Cu(II) (30 μM) and 0–100 μM DOPAL for 5 hours. Cells were then stained with 4,6-diamidino-2-phenylindole (1:2000) (blue) and human tubulin antibody (1:1500) (green). Immunofluorescence and nIRF were visualized microscopically. Scale bar in images is 20 μm. Treatment with DOPAL produced nIRF signals, suggesting the presence of quinoproteins.

