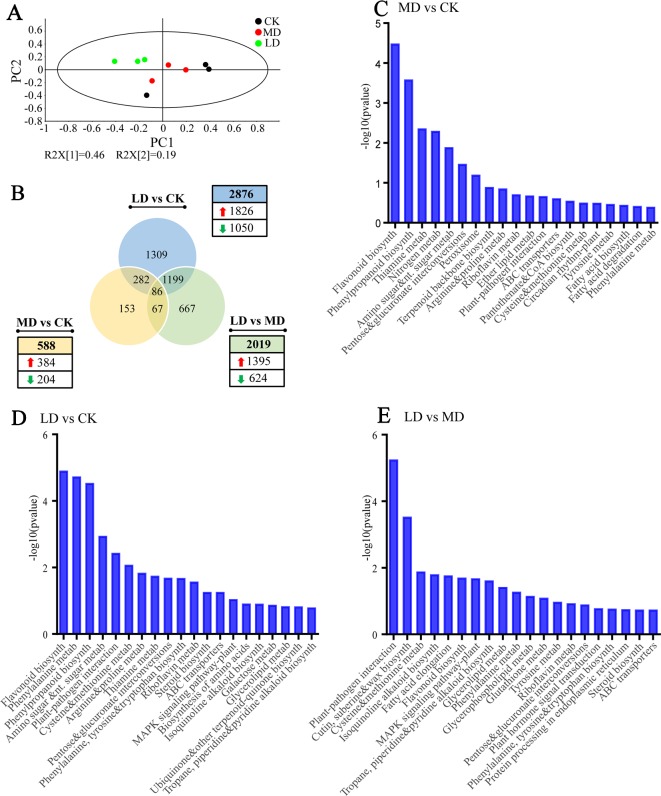
Figure 4.
Overview of tea leave transcriptome subjected to mechanical damage and tea green leafhopper infestation. (A) PCA score plot based on normalized gene count data from all samples. (B) Venn diagram showing the numbers of common and specific DEGs among different treatment groups. (C) Analysis of KEGG Orthology (KO) pathway enrichment of DEGs between MD and CK. (D) Analysis of KO pathway enrichment of DEGs between LD and CK. (E) Analysis of KO pathway enrichment of DEGs between LD and MD. The x axis in (C), (D), and (E) represents KEGG pathways while the y axis represents the -log10 (p-value). LD, tea green leafhopper-infested leaves; MD, mechanically damaged leaves; CK, undamaged control.

