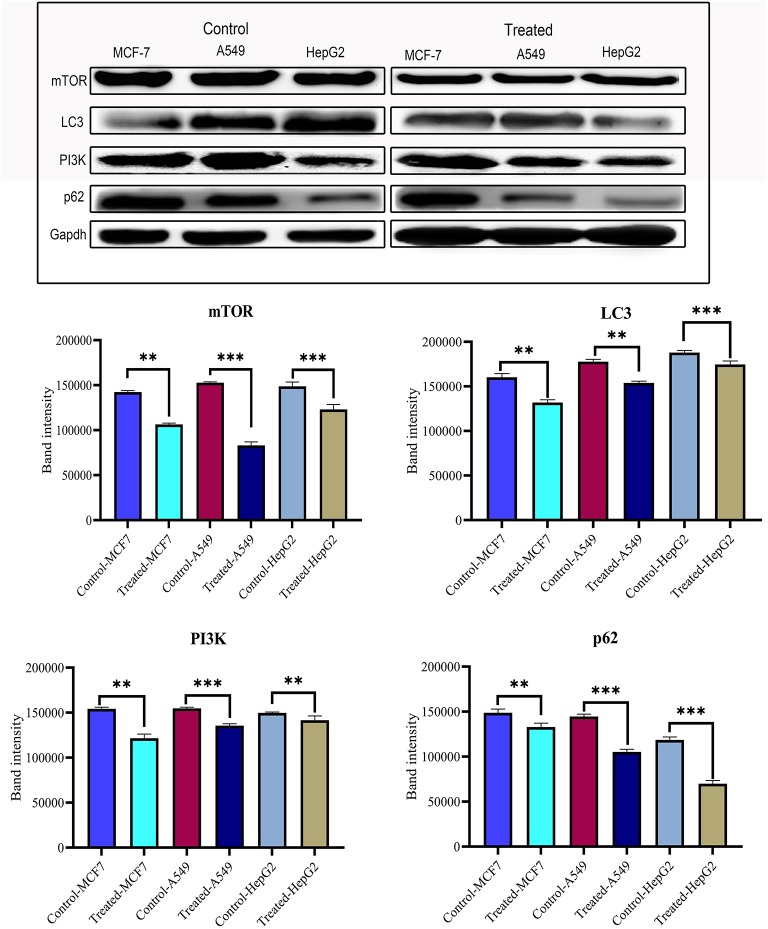
Figure 6.
Western blot and statistical analysis of proteins from PI3K/AKT/mTOR signaling. Overexpression of AKT and downregulation of mTOR, LC3, PI3K, p62, and Beclin 1 have also been observed. Blots were compared with those of GAPDH expression to compare equal loading of samples. Representative blots from three independent experiments are shown (P < 0.05). **p ≤ 0.01, ***p ≤ 0.001.

