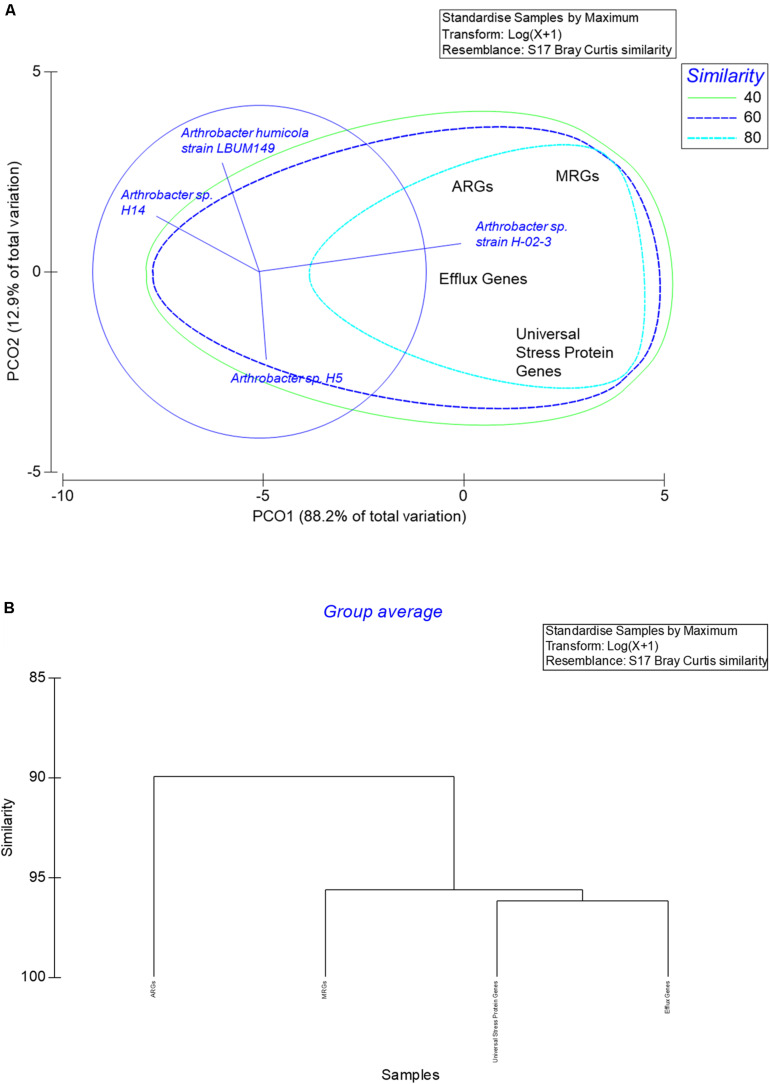
FIGURE 9.
Shown are (A), the PCoA ordination plot of the number of genes related to mercury resistance, antimicrobial resistance, efflux, and universal stress response proteins in strain H-02-3 relative to three closest phylogenetic relatives. Above stated gene were binned based on the merA gene homology in strain H-02-3 and analyzed using the Bray Curtis similarity matrix. (B), cluster analysis of the selected gene classes in H-02-3 relative to three closest phylogenetic relatives.

