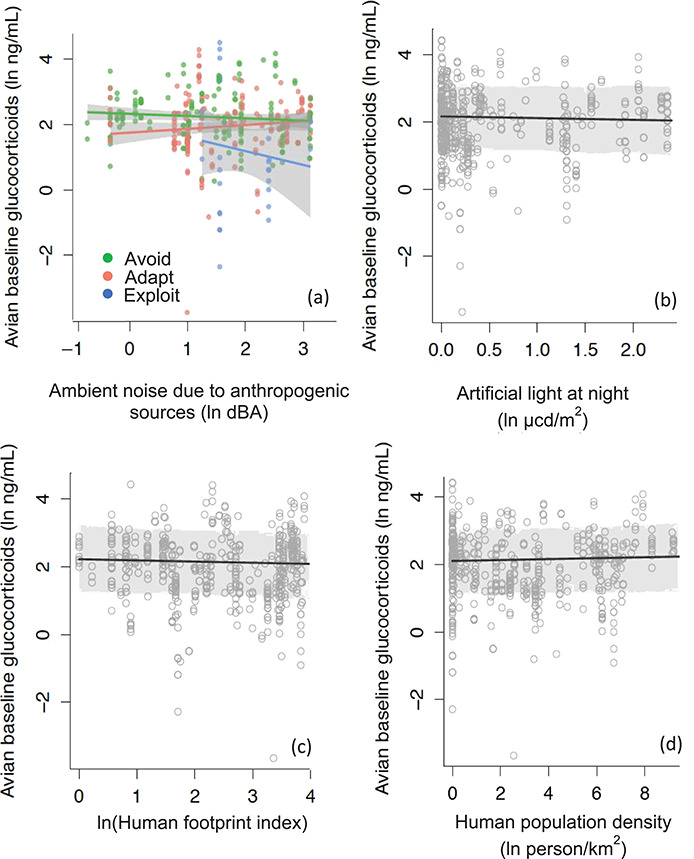
Figure 2. Relationships between (a) anthropogenic noise (data split by urban adaptability, US-only data), (b) ALAN (global data), (c) human footprint index (global data) and (d) human population density (global data) and avian baseline cort. Circles represent raw data points, whereas lines represent model outputs with 95% CI (shaded region). Figures were created by allowing the dependent variable to vary, while all other predictors were held constant.

