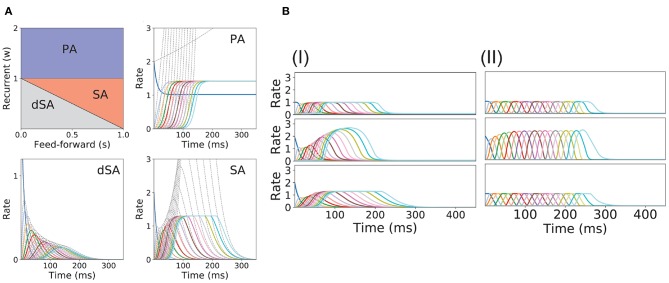
Figure 2.
PA and SA generation in a network with fixed connectivity. (A) Phase diagram for model (I) using a piecewise linear transfer function (top-left plot) and examples of the dynamics corresponding to the three phases. Dashed lines correspond to the dynamics for the same network but using a linear transfer function. (B) SA generation for models (I) and (II) using sigmoidal (first row), piecewise non-linear (second row), and piecewise linear (third row) transfer functions. The parameters for the transfer functions are the same as the ones used in Figure 1B. Firing rates of excitatory populations are colored according to their position in the feedforward-recurrent connected excitatory network. Parameters used in (A,B) can be found in Table S1.

