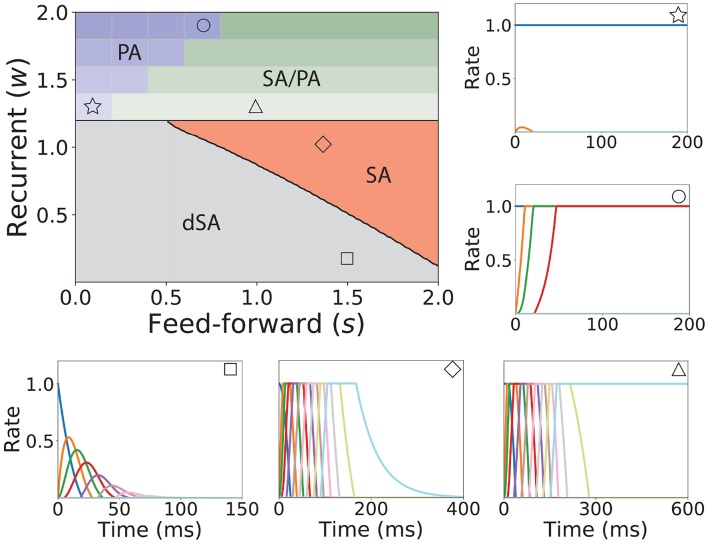
Figure 3.
Bifurcation diagram for feedforward-recurrent connected network of excitatory populations with shared inhibition. Top left plot: Bifurcation diagram in the s-w plane, showing qualitatively different regions: dSA (gray), SA (red), SA/PA (green), and PA (blue). The PA region is divided in sub-regions which are distinguished by the maximum and minimum number of populations active during PA (see text). The SA/PA region is also subdivided into sub-regions characterized by a different number of the maximum number of populations active in PA at the end of the sequence. Regions are separated by black lines and sub-regions are separated by gray lines. Five plots encompassing the bifurcation diagram show examples of the dynamics observed in its four qualitatively different regions. Initial condition: first population active at the maximum rate, while the rest is silent. The location in the corresponding regions of the parameter space are indicated with the symbols on the top right of the surrounding plots. Parameters can be found in Table S2. Firing rates of excitatory populations are colored as in Figure 2.

