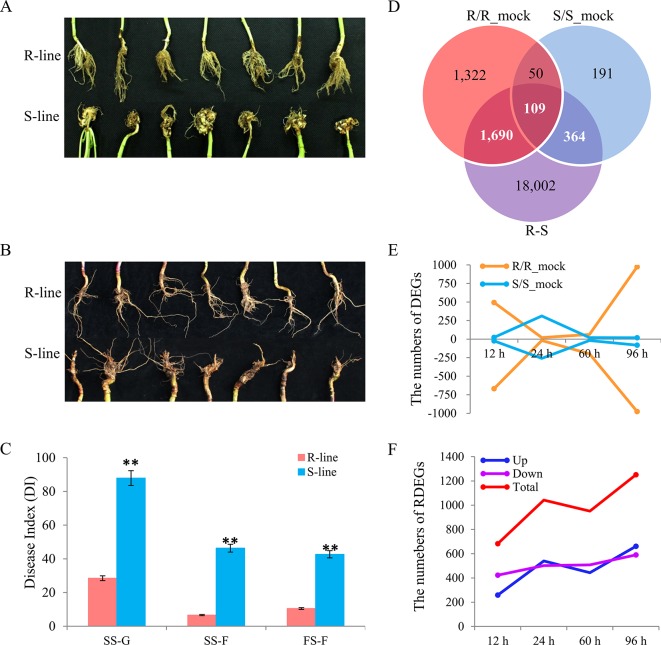
Figure 1.
Phenotype characterization in different environments, and identification of differentially expressed genes (DEGs) and relative differentially expressed genes (RDEGs) after infected by Plasmodiophora brassicae. Phenotype difference between the R- and S-line at seedling stage (A) and flowering stage (B). (C) Disease index of the two accessions in different environments. SS-G, SS-F, and FS-F indicated the seedling stage in greenhouse, field, and the flowering stage in field, respectively. (D) Venn diagram of DEGs in the R/R_mock, S/S_mock, and R/S. The sum of white and bold numeral represented the number of RDEGs. (E) Dynamic variation of up- and down-DEGs in each accession. The negative indicated the number of down-DEGs. The yellow and blue line indicated the DEGs of R- and S-line compared with the corresponding mock group, respectively. (F) Dynamic variation of RDEGs. The blue, purple, and red line indicated the up-, down-, and total RDEGs, respectively.

