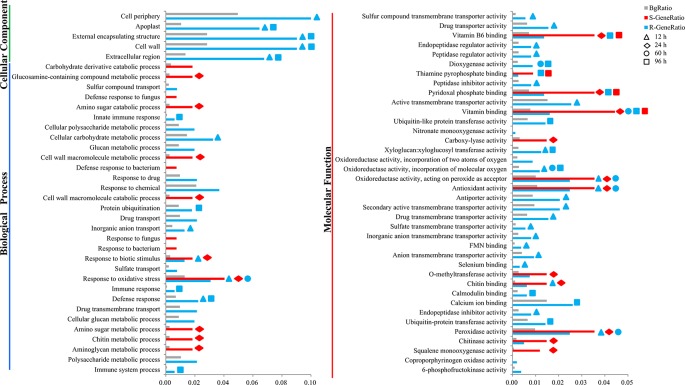
Figure 2.
Gene ontology (GO) enrichment analysis of the differentially expressed genes in the R- and S-line. The y-axis meant the GO terms enriched in the R- or S-line belonging to three categories, and the x-axis meant the percentage, which calculated by the formula that the gene number enriched in each term dividing that in corresponding categories. The gray, red, and blue pillars meant the percentage in the background, S-line, and R-line, respectively. The pillars marked with the shape of triangle, rhombus, circle, and square represented the terms enriched at 12, 24, 60, and 96 h after infection, respectively.

