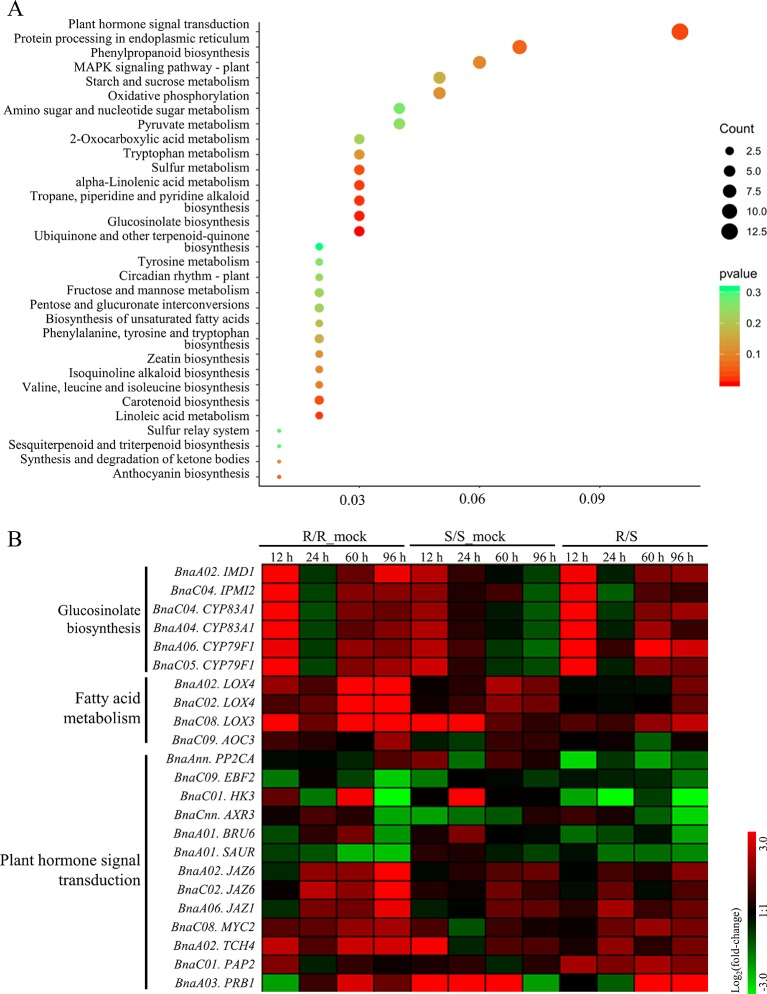
Figure 3.
Kyoto Encyclopedia of Genes and Genomes enrichment analysis of relative differentially expressed genes and expressional differential analysis of genes enriched in important pathways. (A) The size of dot indicated the number of gene enriched in each pathway, and the color of dot meant the significance (p value) of each pathway. (B) Heat-maps showed the log2 fold-change of the genes enriched in important pathways at each sampling time point after infection.

