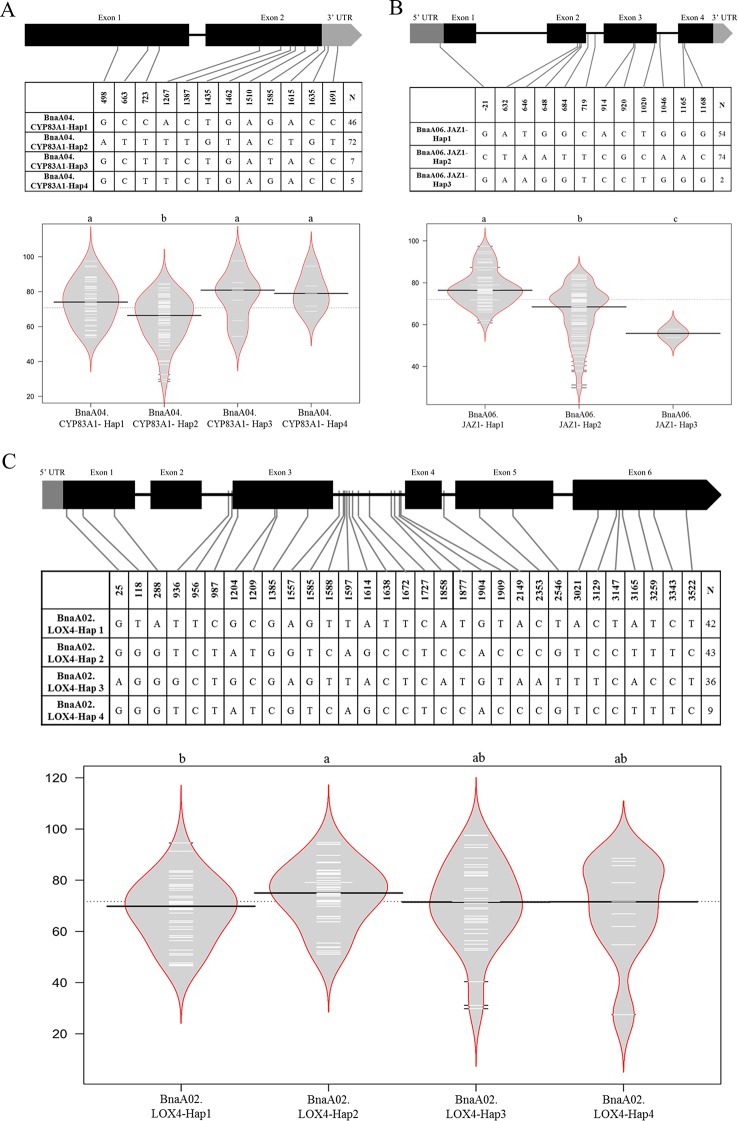
Figure 6.
Haplotype analyses of BnaA04.CYP83A1 (A), BnaA06.JAZ1 (B), and BnaA02.LOX4 (C). The exon, and UTR in the gene structure were displayed with black, and gray box, respectively. The single nucleotide polymorphism (SNP) positions were connected to the haplotype table by lines, and the number of accessions carrying each haplotype was indicated in the columns of right. The difference significance analysis among haplotypes was displayed by the violin plot, in which the black and white horizontal lines represented the medians and individual data points, respectively.

