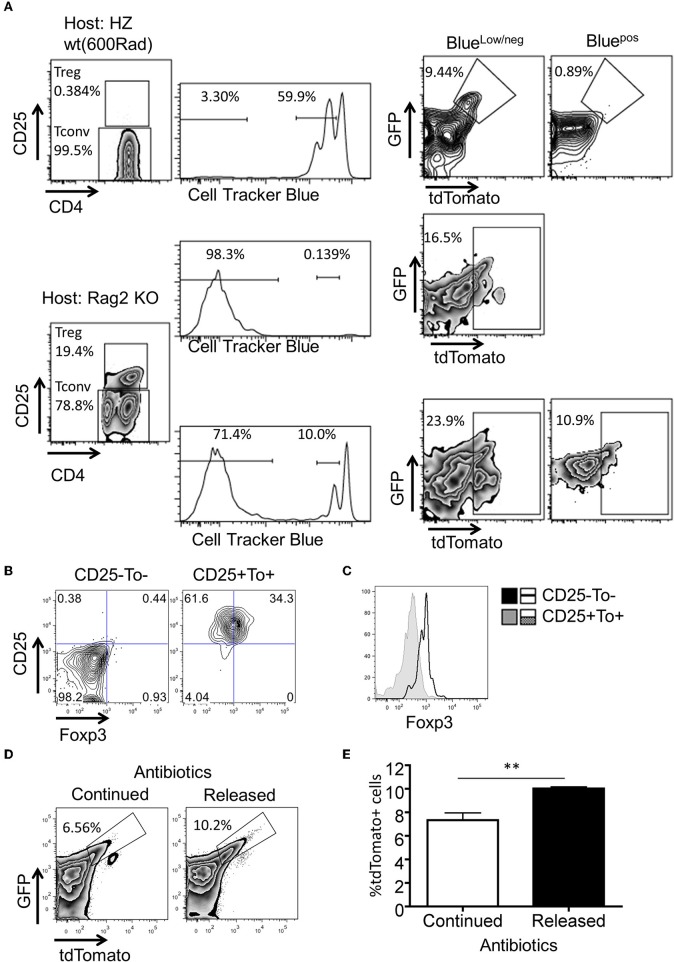
Figure 4.
Microbiota antigens stimulate the expansion of eTregs. Purified tdTomato−CD4+ T cells were labeled with CTB dye and transferred to either sublethal irradiated WT mice or Rag2 KO mice. Four days post cell transfer, tdTomato expression in the splenocytes of the recipients was analyzed. (A) FACS plots for the percentage of tdTomato+ cells in subpopulations of donor cells. (B,C) FACS plots and histogram of Foxp3 expression in tdTomato+CD25+ cells from RAG2−/− group. (D) The percentage of tdTomato+ Tregs in indicated groups. (E) Statistics for tdTomato+ cells in Tregs from two groups (n = 4). Each plot represents three independent animals. The experimental procedure for (D,E) was described in Methods. **P < 0.01.

