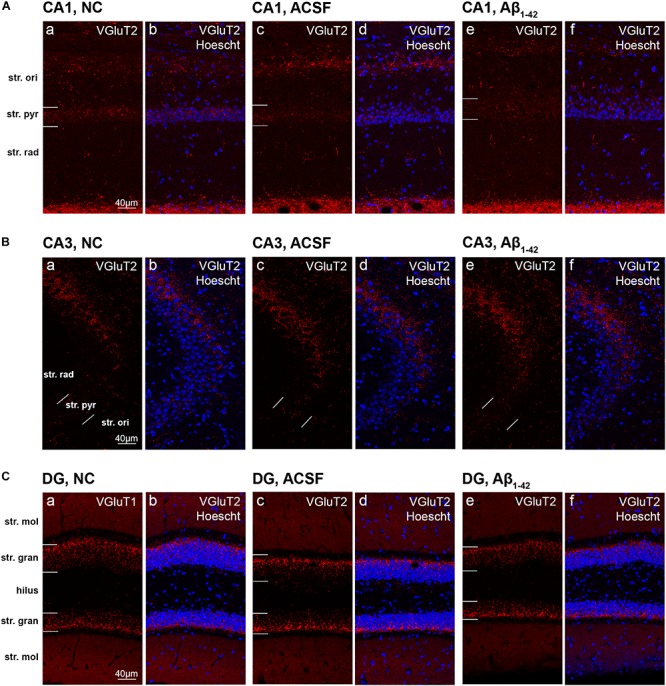
FIGURE 12.

VGluT2 expression in the mouse hippocampus 3 days post-injection. (A–C) Representative confocal images show VGluT2 (red) and Hoescht (blue) immunofluorescence for NC (a,b), ACSF-injected (c,d), and Aβ1–42-injected mice (e,f) in the CA1 (A), CA3 (B), and DG (C) regions of the hippocampus. Scale bars = 40 μm.
