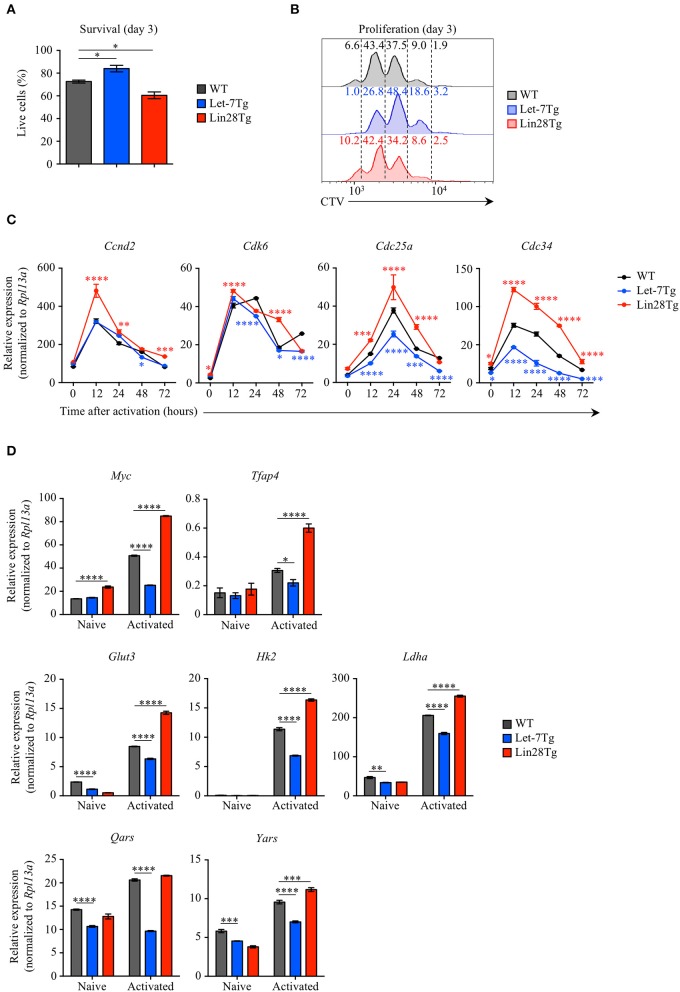
Figure 3.
Let-7 miRNAs control the proliferation of CD4+ T cells by negatively regulating metabolic reprogramming and cell cycle progression. (A) Survival rate of WT, Let-7Tg and Lin28Tg CD4+ T cells activated in vitro for 3 days with α-CD3 and α-CD28 mAbs (5 μg/mL each) as analyzed by trypan blue exclusion. (B) Proliferation of Cell-Trace Violet-labeled WT, Let-7Tg and Lin28Tg CD4+ T cells activated in vitro for 3 days α-CD3 and α-CD28 mAbs (5 μg/mL each) as analyzed by flow cytometry. Numbers indicate the cell frequencies within the indicated gates for each genotype. (C) Quantitative RT-PCR analysis of the cell cycle regulators, cyclin D2 (Ccnd2), cyclin-dependent kinase 6 (Cdk6), cell division cycle 25a phosphatase (Cdc25a), and ubiquitin-conjugating enzyme E2 Cdc34 (Cdc34) in naïve CD4+ T cells activated with plate-bound α-CD3 and α-CD28 mAbs (5 μg/mL each) for increasing time periods as indicated, presented relative to results obtained for the ribosomal protein Rpl13a (control). (D) Quantitative RT-PCR analysis of the transcription factors Myc (Myc) and AP-4 (Tfap4), as well as Myc direct target genes involved in glycolysis and protein synthesis, glucose transporter 3 (Glut3), hexokinase 2 (Hk2), lactate dehydrogenase A (Ldha), glutamyl-tRNA synthetase (Qars) and tyrosyl-tRNA synthetase (Yars) in naïve CD4+ T cells activated with plate-bound α-CD3 mAbs and α-CD28 mAbs (5 μg/mL each) for 48 h, presented relative to results obtained for the ribosomal protein Rpl13a (control). *p < 0.05, **p < 0.01; ***p < 0.001, ****p < 0.0001 (A,C,D), compared with WT using two-tailed Student's t-test. Data are from one experiment representative of at least two independent experiments (A,C,D; mean ± S.E.M. of technical triplicates of each population from all mice) or from two independent experiments (B).

