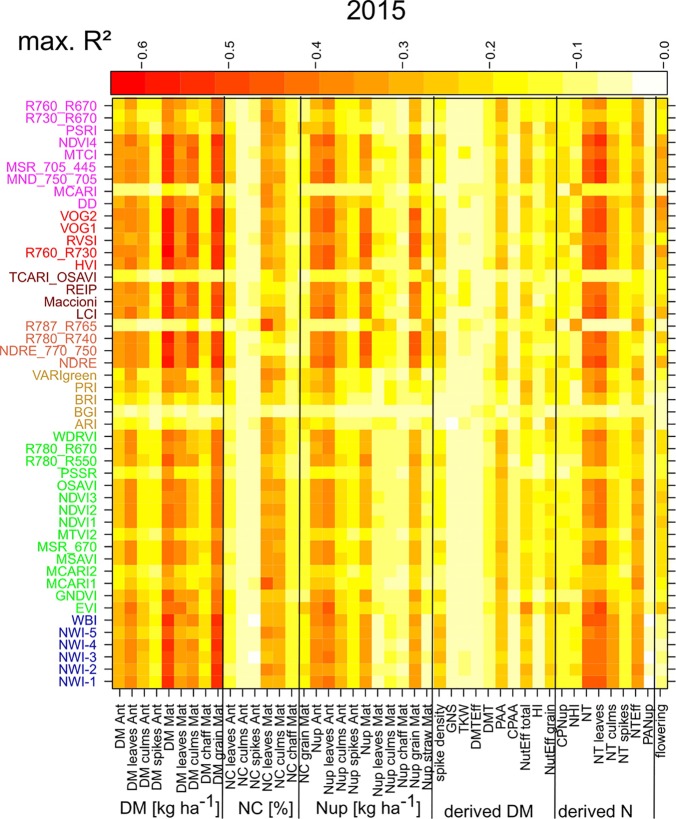
Figure 1.
Maximum coefficients of determination (R²) calculated across the R² values of the different measurement dates in 2015 by trait/SVI combinations. Indices are colored according to the included spectral regions (Supplementary Figure 1; from bottom to top): NIR (blue), NIR/VIS (green), VIS (orange), NIR/RE (light red), NIR/RE/VIS (brown), RE (red), RE/VIS (purple). Refer to Supplementary Figure 4 for results of the other years.

