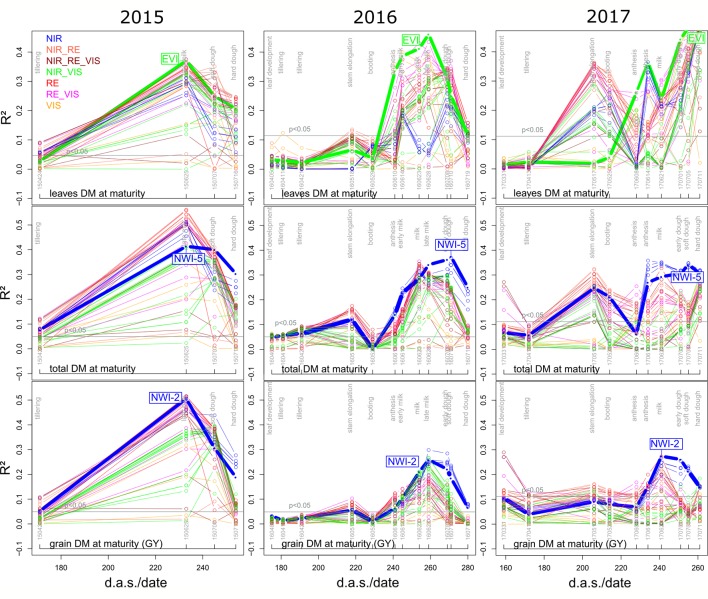
Figure 3.
Seasonal coefficients of determination (R²) of selected direct DM traits in the three years for the tested 48 SVI. Index lines are colored according to the included spectral regions (Supplementary Figure 1; Table 3). Horizontal lines indicate the significance thresholds (p < 0.05), differing between years due to the differing number of data points. Thick lines indicate R² values of the labeled rank-based best index per trait (Figure 2; Table 4).

