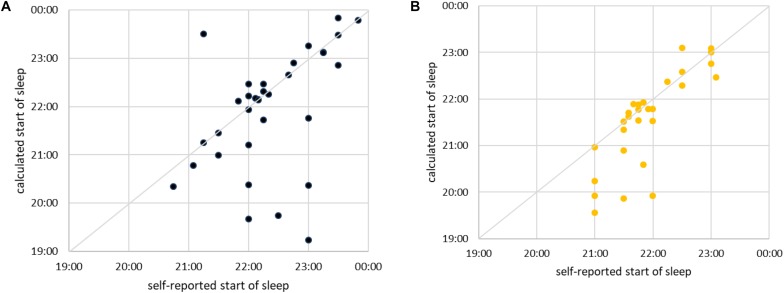
FIGURE 12.
(A) Scatter plot of self-reported time of falling asleep (shown horizontally) vs. time of falling asleep calculated via best shapelet as described in the text (shown vertically) for male subjects. Each subject is shown as one point. The diagonal is marked for easier orientation. For simplicity and easier comparison, we took only subjects who fell asleep between 19:00 and 00:00. (B) The same for female subjects.

