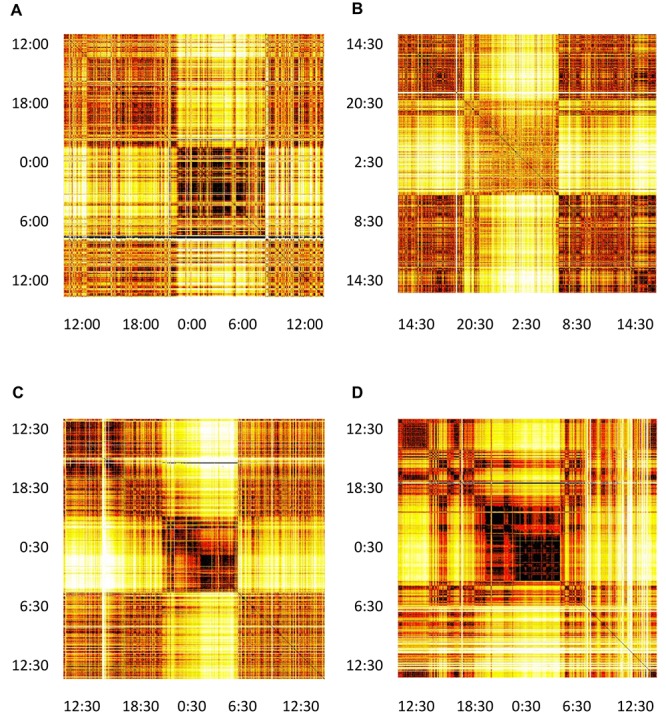
FIGURE 5.

Distance matrices for four selected subjects visualized as heat-maps. (A) Male subject, 21 years of age, (B) Female subject, 23 years of age. (C) Male subject, 49 years of age. (D) Female subject, 50 years of age. All matrices have 24 h of measurements indicated both horizontally and vertically. The color of each matrix element indicates the distance between the two segments, identifies as x and y coordinate of that matrix element (we neglect the asymmetry of this matrix, see section “Discussion” in the text). Darker colors represent shorter distances and brighter colors larger distances, so that darker cells indicate that two segments have similar heart activity, while brighter colors connect segments with different heart activity. It can be noted that sleep shows more self-similarity than awake.
