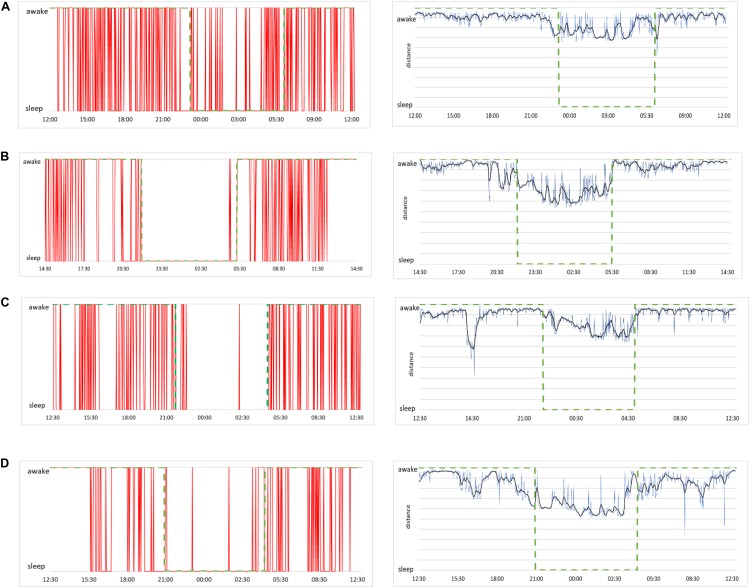
FIGURE 9.
(A, left) Sleep and awake stages determined by our method for the case of a male subject, 21 years of age. Red lines indicate consciousness status as a binary value (sleep or awake) as a function of time over 24 h of measurement. (A, right) Raw data of distances from the best shapelet as function of time for the same subject (blue line), smoothed via Butterworth filter (black line) for better clarity. Green dashed line shows the self-reported information in both plots. (B) The same plots for a female subject, 23 years of age, (C) a male subject, 49 years of age, and (D) a female subject, 50 years of age.

