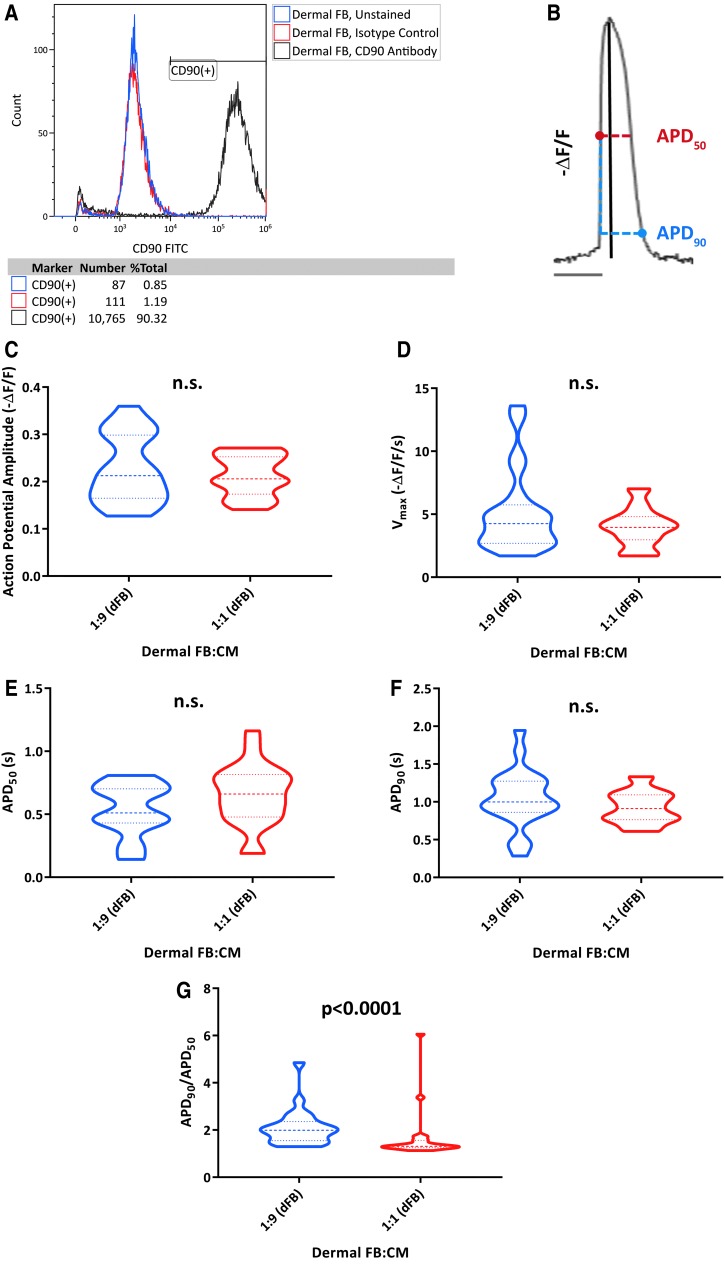
FIG. 2.
dFBs demonstrate the influence of a CD90-positive cell type upon hiPSC-CM electrophysiology. (A) Analysis of CD90 expression in dFBs by flow cytometry. (B) Optical tracings of negative change in fluorescence over fluorescence (-ΔF/F) permit analysis of AP properties of CMs, including APD50 (AP duration at 50% repolarization, horizontal red dotted line), APD90 (horizontal blue dotted line), amplitude (black line), and maximum upstroke velocity (Vmax, not shown). (C–G) Analysis of AP amplitude (C), Vmax (D), APD50 (E), APD90 (F), and APD90/APD50 (G) for 1:9 (1 part dFB to 9 parts CM) and 1:1 co-cultures. Data were collected from two different hiPSC-CM clones on day 40 of differentiation. 1:9: n = 22 cells; 7:3: n = 22 cells. Heavier dashed lines within each violin indicate medians and lighter dashed lines indicate interquartile range. P values were calculated by either Student's t-test (AP amplitude, APD50, APD90) or Mann-Whitney U test (Vmax, APD90/APD50). AP, action potential; APD50, action potential duration at 50% repolarization; APD90, Action potential duration at 90% repolarization; dFBs, dermal fibroblasts; hiPSC-CM, human induced pluripotent stem cell-derived cardiomyocyte.

