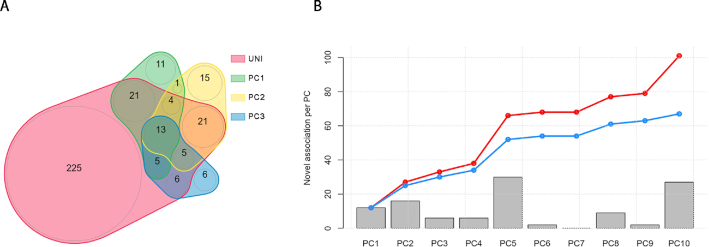
Figure 6.
Overview of results from example 2. We performed the sumZ test for the analysis of 20 phenotypes while using weights inspired from the HIPO approach, i.e. using the loadings from the 10 first PCs of the genetic correlation matrix, weighted by the inverse of the covariance matrix. (A) The overlap of identified loci across the univariate screening and the top 3 PCs. (B) The number of loci found associated for each PC on top of those identified by the univariate screening at a P-value threshold of 5 × 10⁻⁸. The red line indicates the cumulative number of additional signals when merging new signals from an increasing number of PCs. The blue line indicates the same cumulative number of new signals after applying Bonferroni correction accounting for the total number of PCs analyzed.

