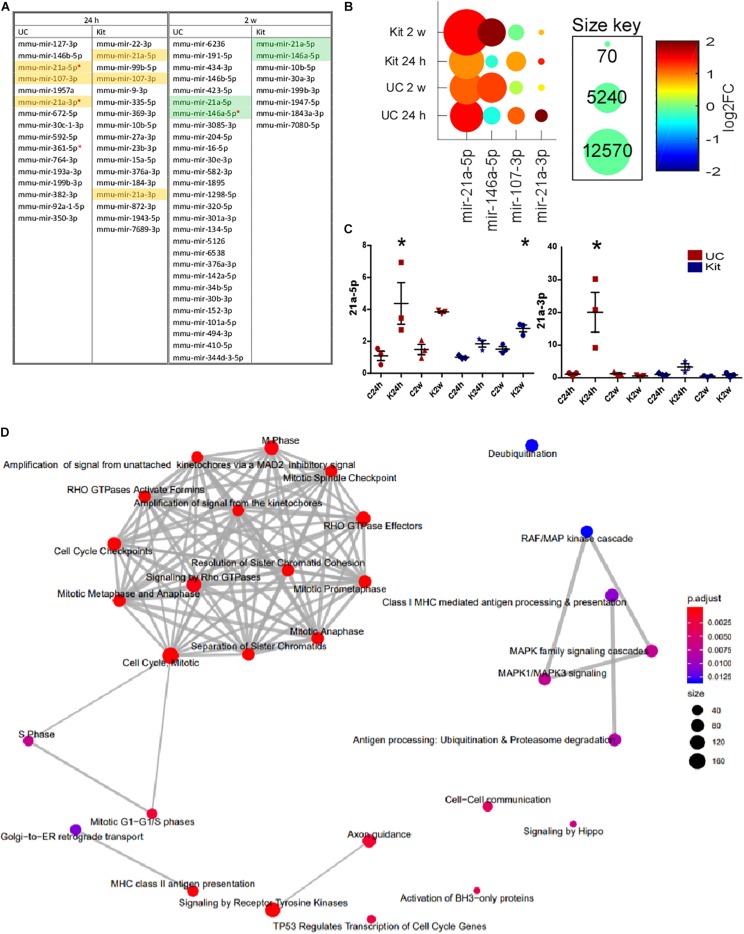
FIGURE 7.
Differential expression of miRNA in EEFs after status epilepticus. (A) The table shows miRNA which were detected as differentially expressed between control and KA at 24 h and 2-weeks, at unadjusted p-value ≤ 0.05. Highlighted miRNAs are those differentially expressed in EEFs using both UC and kit methods. Red asterisk indicates miRNA which were differentially expressed at an adjusted p-value ≤ 0.05 in UC samples. (B) Conserved miRNA changes after status epilepticus. The graph shows levels of miR-21a-3p, miR-21a-5p, and miR-107-3p (increased at 24 h), and miR-21a-5p and miR-146a-5p (increased at 2-weeks). Of these, significance for miR-21a-3p and miR-21a-5p at 24 h and miR-146a-5p at 2-weeks was only found in the UC method at an adjusted p-value of <0.05. (C) Validation of sequencing results using individual miRNA assays confirming increased miR-21a-5p and -3p. UC, in red; kit, in blue. miRNA levels are normalized to average of 25-3p and 92b-3p. Graphs show mean ± SEM. ∗p < 0.05 comparing to matching control. n = 3 per group using the same samples as were sequenced (ANOVA with Bonferroni post hoc test). (D) Network map of GO terms significantly enriched among the targets of the four miRNAs (miR-21a-3p, miR-21a-5p, miR-107-3p, and miR-146a-5p). The network was generated using ReactomePA R/Bioconductor package. The node color indicates the significance of the enrichment (adjusted p-value) while the node size indicates the number of miRNA targets were found in that GO term category.

