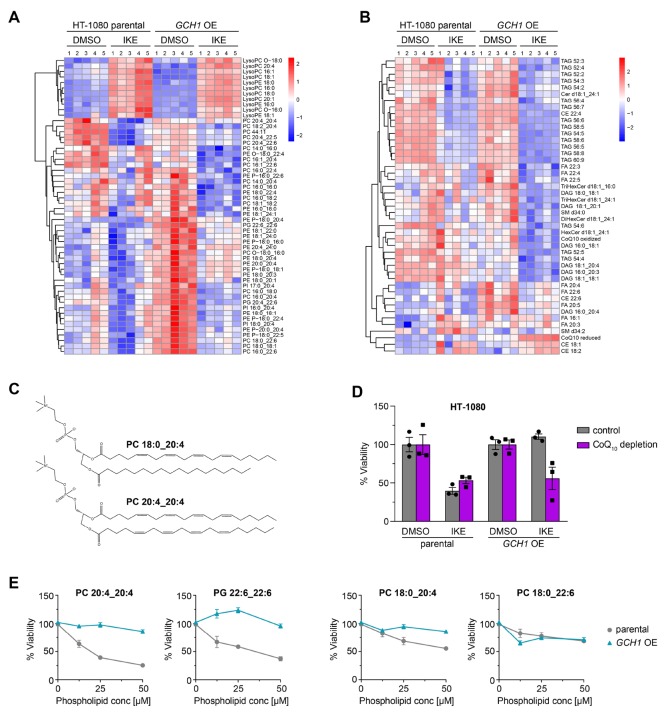
Figure 4.
Untargeted lipidomics reveals GCH1 overexpression cells protect from ferroptotic degradation of specific lipids. Heat map (one-way ANOVA; FDR-corrected p-value <0.05) showing changes in phospholipid profile (A), and glycerolipid, sphingolipid, and free fatty acid profiles (B) of DMSO or 10 μM IKE treated GCH1-overexpressing (GCH1 OE) and parental HT-1080 cells. Each row represents Z-scored-normalized intensities of the differentiated lipid species. Each column represents the mean of n = 2 technical replicates of n = 5 independent biological replicates. The relative abundance of lipid is color-coded from red indicating high signal intensity to dark blue indicating low intensity and clustered using Pearson correlations. Abbreviations: PC, phosphatidylcholine; PE, phosphatidyl-ethanolamine; PI, phosphatidylinositol; PG, phosphatidylglycerol; LPC, lysoPC; LPE, LysoPE; PE P-, plasmalogen PE; PC/PE -O, ether-linked PE/PC; TAG, triacylglycerol; DAG, diacylglycerol; FA, fatty acid; CE, cholesterylester; CoQ10, coenzyme Q10; Cer, ceramide; HexCer, monohexosyl-Cer. (C) Line structure of representative phospholipids PC 18:0_20:4 with one saturated acyl chain and one polyunsaturated fatty acyl (PUFA) chain, as well as PC 20:4_20:4 with two PUFA chains. (D) Treatment of parental and GCH1 OE HT-1080 cells with 4-nitrobenzoate in the absence of CoQ10 with ferroptosis induction by 8 μM IKE. Viability is plotted as biological replicates ± SEM n = 3. (E) Treatment of parental and GCH1 OE HT-1080 cells with exogenous PC 20:4_20:4, 18:0_20:4, 18:0_22:6, and PG 22:6_22:6 (concentrations 0–50 μM). Viability is plotted as mean ± SEM of n = 4 replicates.

