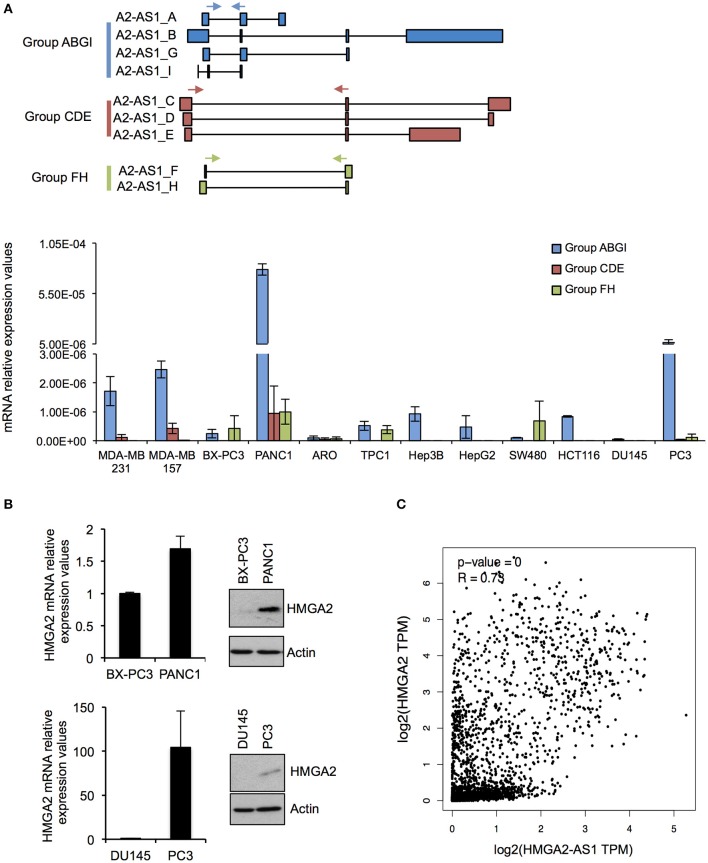
Figure 3.
HMGA2-AS1 transcript variants are expressed in cancer cell lines. (A) Upper part shows a schematic representation of primer localization (cyan, red and green arrows) used for amplifying HMGA2-AS1 transcript variants, grouped in Group ABGI (cyan), Group CDE (red), and Group FH (green). Lower part shows qRT-PCR analysis of the three transcript groups in a panel of cancer cell lines. 18S was used for normalization. Data are presented as the mean of 2∧–DCt ± range between replicates (n = 2). (B) qRT-PCR and western blot analyses of HMGA2 in BX-PC3, PANC1, DU145, and PC3 cancer cell lines. For qRT-PCR 18S was used for normalization. Data are presented as the mean ± range between replicates (n = 2). For protein analysis a representative western blot is reported. β-actin was used as loading control (n = 2). Also see uncropped figure scan in Supplemental Images 1, 2. (C) Plot of correlation of HMGA2 and HMGA2-AS1 expression in a TCGA dataset that includes BRCA (Breast invasive carcinoma), COAD (Colon adenocarcinoma), LIHC (Liver hepatocellular carcinoma), PAAD (Pancreatic adenocarcinoma), PRAD (Prostate adenocarcinoma), and THAC (Thyroid carcinoma) datasets. Data were presented in log2 scale and Spearman correlation coefficient was used.

